Fundamentally Speaking
Soybean Oil Retreats From Record High Levels
It's been a pretty wild ride for both cash and board soybean crush margins this year as soybean oil in both absolute price in cents per pound and as a percent of the combined soybean crush value moved to record highs.
In the process this helped push the soybean crush margin (the difference between the revenues received for the 11 pounds of soybean oil and the 44 pounds of 48% protein soybean meal) and the cost of crushing the bushel of soybeans needed to produce these quantities also to new record highs.
Recently however a dramatic collapse in the value of all vegetable oils, including soybean oil, and relatively firm soybean prices with a dwindling supply of 2021 bushels had sent the 2022 spot CME soybean crush margin from an all-time high of about $3.00 per bushel at the beginning of March to as low as 73 cents per bushel as of the second week of June before recently rebounding to a still historically high $1.81 per bushel.
P[L1] D[0x0] M[300x250] OOP[F] ADUNIT[] T[]
This $2.25 per bushel swing on spot crush margins is already the largest in history, topping the year-ago $1.53/bushel range and begs the question as to where board crush margins go from here.
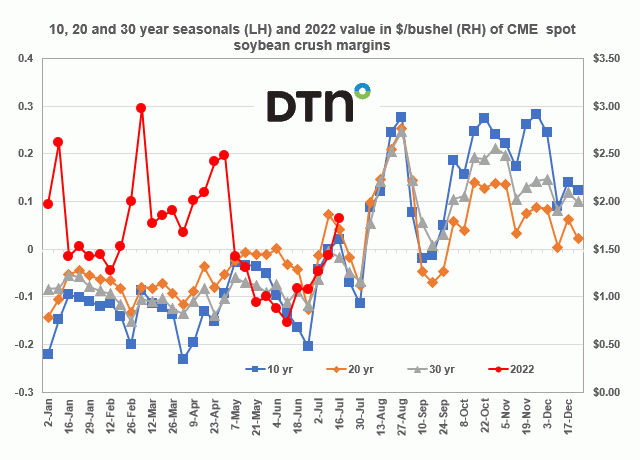
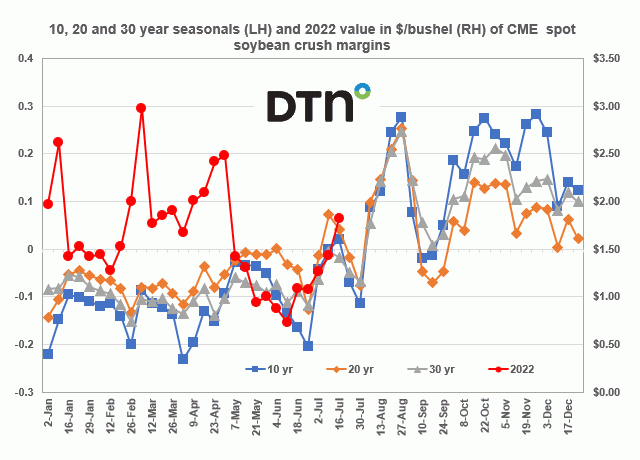
This chart shows the 10, 20 and 30-year seasonal of the spot CME soybean crush margin on the left-hand axis and the actual value of the daily 2022 prices in dollars per bushel so far this year on the right-hand axis.
For the first quarter of the year the 2022 prices have really not followed the usual seasonal patterns at all, spiking to new all-time highs at the beginning of March at a time when crush margins usually contract with the start of the South American harvest but less than expected output out of Brazil kept our crush margins high at a time when they usually weaken.
2022 soybean crush margin prices for the second quarter have shown more adherence to the seasonal patterns with prices tending to rally from April into the beginning of June and then retreating before rallying for the month of July.
Then from August into September crush margins tend to be at their highest point of the year before falling into October and then pushing higher for the duration of the year.
Thus the seasonal charts indicate that the highs in this year's spot crush margins are yet to be seen though much will depend on how the U.S. crop fares and how soybean oil and soybean meal demand holds up both domestically and with regard to exports.
(c) Copyright 2022 DTN, LLC. All rights reserved.


Comments
To comment, please Log In or Join our Community .