Fundamentally Speaking
Corn & Soybean Yield Trends
Well before the first planters roll next spring, there has already been a lot of discussion about the impact of record fertilizer prices and soaring energy prices on agricultural production and how this may influence the mix of crops that are put in the ground.
Sentiment appears to be that the high price of nitrogen-based fertilizer in particular will push economics more in favor of soybeans than corn since the former uses less fertilizer and is the cheaper crop to plant.
Variables to consider include the expected yield, the expected price and of course all the associated costs of production.
One factor that we have pondered over is the relative performance of corn and soybean yields over the years and how this may be part of the equation.
P[L1] D[0x0] M[300x250] OOP[F] ADUNIT[] T[]
In looking at the state of Illinois we see that at least there since 2007 corn acreage has decreased and soybean area has increased while over the past two decades corn yields in IL have increased annually by an average of 2.63 bushels per acre (bpa)/year and soybean yields have risen by 1.07 bpa/year.
This is a ratio of 2.46, whereas the U.S ratio is 2.63, indicating that soybean yields have been increasing relative to corn yields at a faster pace in Illinois than seen in the country as a whole and perhaps another reason why more soybeans and less corn will be planted next year.
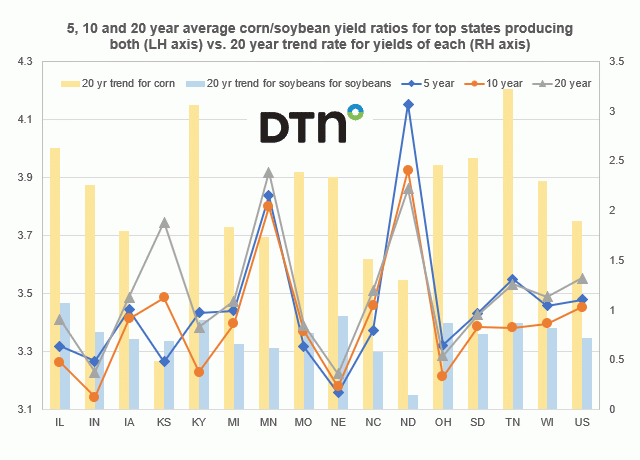
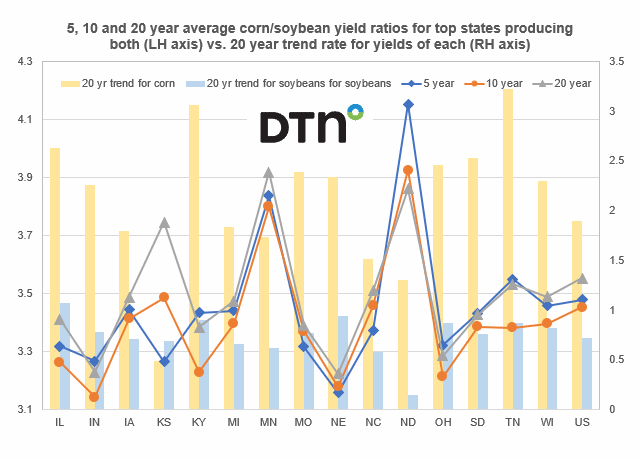
This graphic shows the five, ten and 20-year average corn/soybean yield ratios for 15 top states producing both and the U.S on the left hand axis and the 20-year trend rate increase for both corn and soybean yields on the right hand axis.
First off, we look for those states where corn/soybean yield ratio has risen over the years such as North Dakota where the 20-year ratio is 3.86, rising to 3.92 over the next 10 years, while from 2017 to 2021 the ratio has averaged 4.15.
Conversely there are states where bean yields have risen relative to corn yields over time such as in Kansas where the 20-year corn/soybean yield ratio at 3.75 fell to 3.49 over the past ten years and since 2017 the yield ratio has averaged 3.27.
As for the increase in trend yields, Illinois has seen some very good soybean yields in recent seasons and they have the highest trend increase of all the states at 1.07 bpa/year over the past 20 seasons with KY and NE also seeing yields increase by at least 0.90 bpa since 2002.
On the other hand, helping explain the rising corn/soybean yield ratio in North Dakota is a very low 0.15 bpa trend yield increase for soybeans, by far the lowest of any state with NC and MN not faring well in this department either.
As for trend yield increases in corn, both KY and TN have seen corn yields increase by an average of at least 3.00 bpa per year for the past 20 years while KS the worst at a mere 0.49 bpa which is even lower than their average soybean yield increase of 0.69, the only state that can make that claim.
(c) Copyright 2021 DTN, LLC. All rights reserved.


Comments
To comment, please Log In or Join our Community .