Fundamentally Speaking
Weekly Corn Shipments Need to Increase
The pace of corn export shipments is actually quite low relative to past seasons and there are questions as to whether the current final projected figure 2.650 billion bushel (bb) figure will actually be attained let alone if this estimate is pushed higher in subsequent WASDE reports.
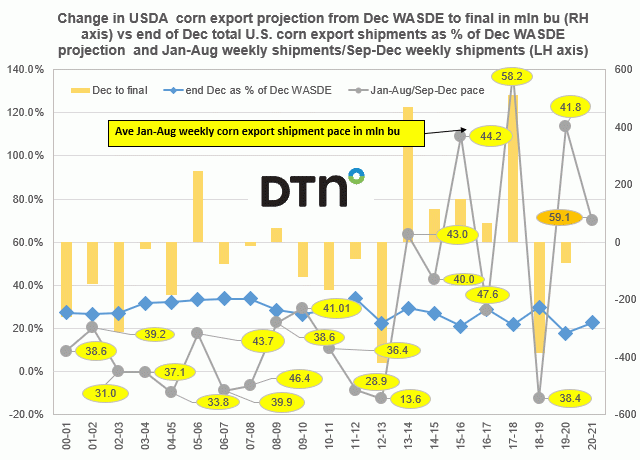
This graphic sheds some light on this as the change in USDA corn export projection from the December WASDE to the final figure in million bushels (mb) is plotted on the right hand-axis vs. the end of December total U.S. corn export shipments as a percent of the of December WASDE projection plotted on the left hand axis.
Also plotted on the left hand axis is the average Jan-Aug weekly shipments pace divided by the average Sep-Dec weekly shipments or expressed another way, the ratio of the average weekly shipment pace for the last two-thirds of the marketing year (Jan-Aug) divided by the average weekly shipment pace seen in the first third of the marketing year (Sep-Dec).
The numbers in the yellow circles are the average shipment pace seen each marketing year from the 2000/01 to 2019/20 season for the Jan-Aug period.
P[L1] D[0x0] M[300x250] OOP[F] ADUNIT[] T[]
Through the first third of the marketing year this season, or by 12/31/2020, the U.S. had shipped out 600.6 mb which is only 22.7% of the December 2020 WASDE projection.
Not only is this below the 20-year average pace for this time of year of 27.9% other than seen a year ago, in the 2017/18, 2015/16 and 2012/13 seasons is the slowest shipment pace of the past twenty years.
In 2012/13 with 22.5% shipped in the first third of the year final exports were 419 mb below the December 2012 WASDE projection, in 2015/16 they were 21.1% yet final exports were 151 mln higher while in 2017/18 with shipments at 21.8% final exports proved to be 513 mln over the December 2017 WASDE while last year 2019/20 shipments were just 17.8% of the December 2019 WASDE and final sales came in 72 million below that.
So there are some years where a slow shipment pace through December resulted in a downward adjustment in final exports, but also years where this was not the case.
Much depends on what sales are like for the remaining two-thirds of the marketing year and in 2012/13 weekly shipments that averaged 15.6 mb from Sep-Dec 2012 fell off even more to 13.6 mb from Jan to Aug 2013, a decline of 12.6%.
Last year's shipment pace of 19.6 mb from Sep to Dec was the lowest over the past 20 years, yet picked up to an average 41.8 mb the next eight months to 41.8 mb, 113% higher, yet this was not enough to prevent final exports from falling by 72 mb.
In 2015/16 weekly export shipments were 44.2 mb from Jan to Aug, 109% from what they were the first four months of the year, while in the 2017/18 season the average Jan-Aug weekly shipments of 58.3 mb compared to the Sep-Dec figure of 24.5%, so export shipments average more than 138% higher than what they were the first four months of the marketing season.
The point is that for the corn shipments to attain the current USDA figure of 2.650 bb they will have to average 59.1 mb each and every week over the next eight months, a 70% increase from the Sep-Dec 2020 average and the most ever given that over the past 20 years shipments the final two-thirds of the marketing year are usually only 27.4% above what they were in the Sep-Dec period.
(c) Copyright 2021 DTN, LLC. All rights reserved.


Comments
To comment, please Log In or Join our Community .