Fundamentally Speaking
Ending Corn Stock Matrix
With the USDA reporting in the June acreage report 2020 corn seedings at 92.006 million acres, a stunning 5 million acre drop from the March intentions, by far the largest March to June decline ever and well below the average trade estimate for a mere 1.80 million acre decline, the tolerance for any yield adversity for this year's U.S. corn crop suddenly got a lot smaller.
Even with large beginning stocks, the largest corn planted area since 2016, and questionable demand both from both domestic users and foreign buyers, the current stressful growing conditions now seen in much of the Corn Belt that are expected to persist over the next two weeks suggest 2020/21 ending stocks could be pared substantially from the current trade range of 2.70-2.9 billion bushels (bb).
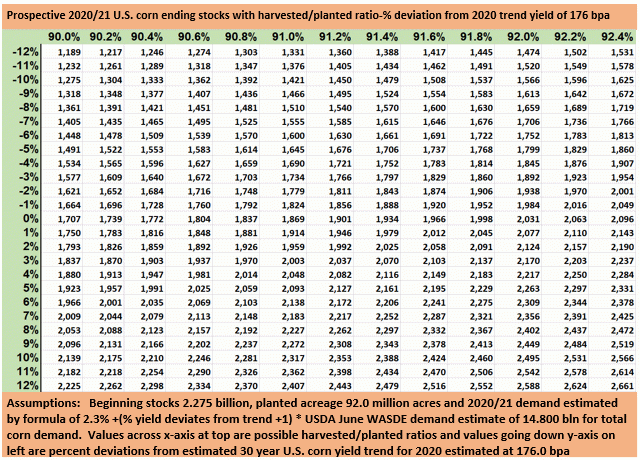
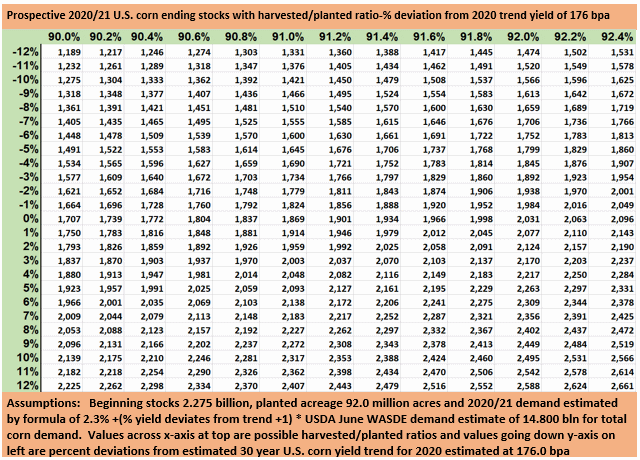
This graphic shows a matrix of what possible corn stocks could be given various harvested/planted ratios and percent deviations from the 2020 trend yield.
Our assumption is that when all is said and done, this year's ending stocks (which is the 2020/21 beginning stocks figure) will be 2.750 billion bushels.
We are using the 6/30 USDA figure of 92.0 million acres and that is multiplied by the possible harvested/planted ratios going across the x-axis at the top to arrive at the harvested acreage figure.
Should point out that the USDA lowered planted area by 5 million acres in the 6/30 Acreage Report, yet harvested acreage was reduced by 5.6 million acres as now the harvested/planted ratio is 91.3% vs. 92.4% last month.
P[L1] D[0x0] M[300x250] OOP[F] ADUNIT[] T[]
Harvested acreage is then multiplied by values going down the y-axis on left which are percent deviations from the estimated 30-year U.S. corn yield trend for 2020 of 176.0 bpa to arrive at a production number.
Note that 176 yield is lower than the current USDA projection of 178.5 bpa which is a new record.
The beginning stocks and production figures together represent total supply and from that we subtract total demand to arrive at an ending stocks figure.
To estimate demand, we did a simple regression of percent yield deviations for each year 1990-2019 vs. the percent change in total demand from one year to the next.
The correlation is not too bad at 65% and does show the relation where large declines in yield result in sizable drops in total consumption and vice versa.
Over the past 30 years the biggest drop in yields relative to trend was in 2012, down 22.8% and total demand that season was off 11.5%, also the largest decline in that time span.
Conversely the best year for yields above trend was in 1994, up 13.3% with demand that season 22.7% higher than the prior year, also the largest year to year gain.
The formula shows for every percent yield is above or below the 176.0 bpa trend total demand will increase or decrease by 0.23%.
As an example, with the harvested planted ratio at 91% and yields 5% below trend, the ending stocks figure in the box is 1.645 bb.
This comes from 92 mln acres times 91% times 176 yield times 95% of that.
This results in production of 13.998 bb and to that we add beginning stocks of 2.275 bb, resulting in total supplies of 16.273 bb.
From that we subtract demand which we estimate at (2.3% plus -5% times 0.69*) the USDA demand projection of 14.800 billion results in total demand of 14.628 bb resulting in ending stocks of 1.645 bb.
© (c) Copyright 2020 DTN, LLC. All rights reserved.


Comments
To comment, please Log In or Join our Community .