
Fundamentally Speaking
Percent Price Moves for Key Commodities

Even before the coronavirus spread, the grain and oilseed markets had been on their heels responding to more than adequate domestic and global stockpiles that were seen increasing perhaps substantially given another year of large South American row crop production, good winter wheat crop outlooks in most key producing regions of the world and if Mother Mature cooperates, a large rise in U.S. corn and soybean seedings this spring.
Now with the COVID-19 pandemic the whole world has been thrown upside down with all equity and commodity markets seeing enormous losses.
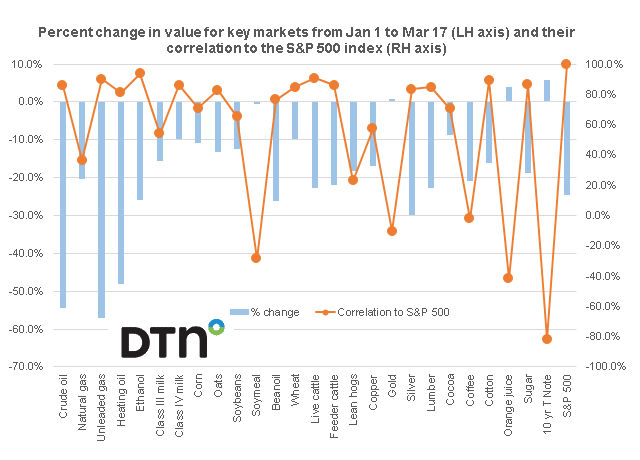
This graph shows the percent decline for a number of key commodities, the 10 year U.S. Treasury note and the S&P 500 stock index on the left hand axis from January 1 to March 17, while the correlation between all of these markets and the S&P 500 stock index for the same time period is plotted on the right hand axis.
The S&P 500, or simply the S&P, is a stock market index that measures the stock performance of 500 large companies listed on stock exchanges in the United States.
P[L1] D[0x0] M[300x250] OOP[F] ADUNIT[] T[]
It is one of the most commonly followed equity indices, and many consider it to be one of the best representations of the U.S. stock market.
Since the start of the year, it is the energy complex that has posted the worst losses on a percentage basis due not only to the coronavirus, but also linked to the all-out price war between Russia and Saudi Arabia as they cannot resolve their differences over pricing and productions strategies in light of the drastic cut in global crude oil demand.
Unleaded gasoline has posted the largest percent drop of 57.2% as some estimate the various quarantines and restrictions have pared driving mileage by up to 15%.
Crude oil has lost 54.3% while heating oil has shed 48.1% and ethanol is off 26.0% since the start of the year.
With soybean oil linked to biodiesel production and corn to ethanol output, it is no surprise that these two have the largest losses in the grain and oilseeds complex at 26.1% and 10.8% respectively.
Interestingly, despite live cattle futures off 22.7% and lean hogs down 18.1%, soybean meal prices are essentially unchanged which next to the traditional safe haven gold which is up a mere 0.6%, soybean meal is the best performing commodity over the past ten weeks and has been able to hold on a spread basis vs. soybean oil which is now trading at the lowest levels in about ten years.
In recent days, many have talked about the downdraft that the huge collapse in share prices has had on commodity values and this is certainly true as a number of commodities have had a correlation with the S&P 500 of 80 to 90%.
Actually soybean meal has had a negative correlation with the S&P 500, a distinction it shares with orange juice while of course the price of the ten year U.S. Treasury note which has moved to all-time highs with yields falling to their lowest point ever has the most negative correlation at -81.6% which is what one would expect.
(KM)
Comments
To comment, please Log In or Join our Community .