
Fundamentally Speaking
Record Animal Numbers Boost Sep-Nov 2019 Corn Feed Demand
Circling back to the slew of USDA reports that were released on January 10, there has been a lot of discussion about the very unusual move by USDA to adjust 2018 corn production and feed/residual use well after the fact.
Recall that the three main demand sectors for corn are that used to feed animals, supplies that are exported and the bushels used for food, seed and industrial purposes (FSI) such as ethanol.
With exports and ethanol production reported on a weekly basis and other FSI utilization distributed essentially on a quarterly basis the only unknown is the feed/residual category, which is backed out of the quarterly stock figures after ethanol and FSI use is subtracted.
Not the best of the situation but as noted before, given USDA lacks a comprehensive national feed model, this has to suffice for now.
P[L1] D[0x0] M[300x250] OOP[F] ADUNIT[] T[]
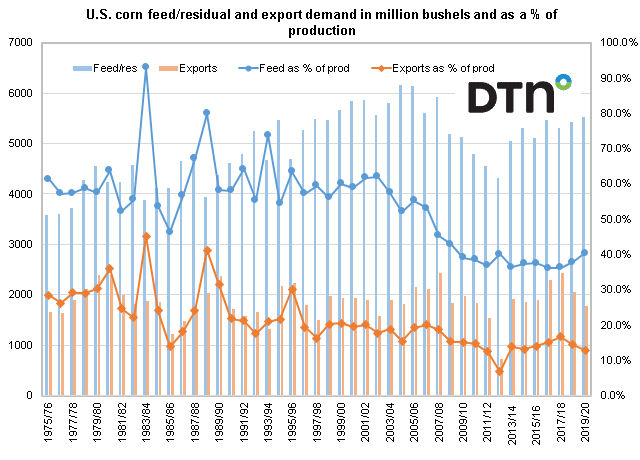
The attached graphic shows U.S. corn feed/residual and export demand in million bushels on the left hand axis while on the right hand axis are both of these plotted as a percent of that year's production.
For a variety of reasons, foreign demand for U.S. grain and oilseeds has waned over the years.
Corn is especially hard hit given increased competition from Argentina, Brazil, Russia and Ukraine among others, while the amount of corn used for renewable fuels purposes has plateaued.
The chart indicates that though corn feed demand has yet to recover to the 6.14-6.16 billion bushel (bb) figures consumed in the 2004-06 period, usage estimated this year at 5.525 bb would be the highest since 5.913 bb was fed in the 2007/08 marketing year.
The amount of corn fed as a percent of production has climbed to 40.4% from what appears to be an all-time low of 36.1% just three years ago.
The high price of corn in the 2007-2013 period undoubtedly contributed to declining feed usage along with the increased amounts of byproducts fed and the enhanced feed efficiency of most animals.
Nonetheless, the recent upturn in corn feed utilization, ongoing since 2012, is based on the increasing amount of grain consuming animal units which at 102.84 million units is the highest ever.
Much of the rise has occurred since 2013 with poultry numbers up 10.6% since then, beef cattle inventories advancing by 13.1% and the swine herd increasing by a stunning 24.2%, all at peak levels with only dairy cow numbers continuing their long-term decline.
(KLM)
© Copyright 2020 DTN/The Progressive Farmer. All rights reserved.

Comments
To comment, please Log In or Join our Community .