Fundamentally Speaking
Year End Price Movement-Volatility Comparison
The year 2019 was characterized by decent economic growth in both the U.S. and world though the economies of Japan and Europe continue to struggle. While GDP supposedly in China expanded by a 6.0% rate, that is still the most sluggish rate of growth in over 30 years as the impact of the trade war with the U.S. was a real depressant.
This year, as opposed to 2018, is ending on a very positive note with the recent signing of the Phase 1 trade accord with China, a new U.S.-Mexico-Canada trade agreement being inked. The stock markets posted their best year on year gains since 2013. This holiday season saw no government shutdown as opposed to the dismal state of affairs as 2018 drew to a close.
P[L1] D[0x0] M[300x250] OOP[F] ADUNIT[] T[]
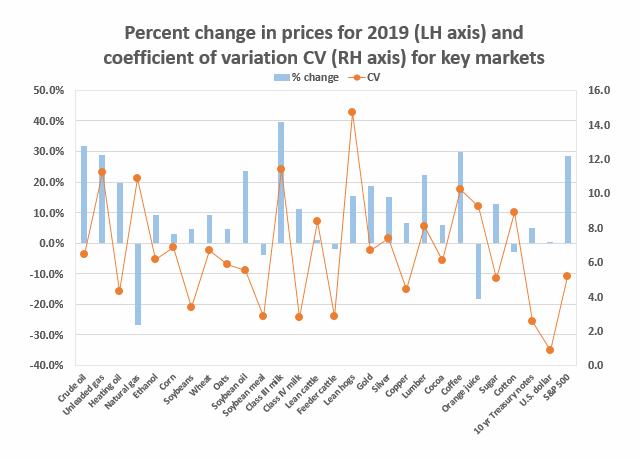
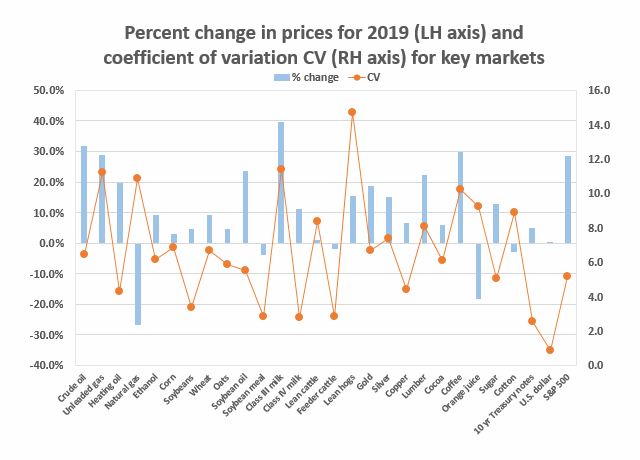
The accompanying graphic shows the net percent price move for a number of key commodities and indices for 2019 as of December 31st, along with a measure of price volatility called the coefficient of variance (CV), which is the standard deviation of the year’s price movements divided by the annual average.
As opposed to last year when only eight of the 25 commodity markets tracked saw price advances led by cocoa’s 27.1% gain, 2019 saw 20 of the 25 markets end the year with higher values than when it started. Gains were led by a smashing 39.7% advance for the Class III milk market (cheese & whey) followed up by a 31.9% gain for crude oil.
Interestingly crude oil was one of the big losers last year, off 25.7% with unleaded gasoline posting the largest declines last year of 27.5%. For 2019, the biggest losers were natural gas which was down 26.7% and orange juice futures tumbled 18.2%. We speculate a mild winter was one of the precipitating factors for those two markets losses.
Very quiet dealings in the foreign exchange market as the value of the U.S. dollar was completely unchanged, that market had the lowest CV of 0.88 as opposed to the lean hog market where prices were buffeted back and forth by news on the U.S.-China trade war and the implications from the African swine fever with the highest CV at 14.70. As for the grain and oilseeds complex, soybean meal was the only one lower, off 3.9% yet its co-product soybean oil which is now trading at two-year highs posted the best gains in the complex advancing by 23.5% for the year.
(KLM)
© Copyright 2020 DTN/The Progressive Farmer. All rights reserved.


Comments
To comment, please Log In or Join our Community .