

Fundamentally Speaking
USDA Corn Stock Projection Changes

Well the USDA WASDE report has come and gone and as we suspected, the first government take on the U.S. corn balance sheet showed the largest bushel reduction in ending stocks from the USDA's Agricultural Outlook Forum estimate in late February to the first new crop supply-demand estimates that are furnished in the May WASDE report.
On February 24 of this year the USDA pegged the 2018/19 corn carryout at 2.272 billion bushels but due to lower beginning stocks, less planted acreage than foreseen 2 ½ months ago and a more buoyant export outlook for the coming year the USDA last week projected next year's ending stocks at 1.682 billion bushels.
This 590 million bushel decline is the largest we have in our database extending back to the 1998-99 season though this year's 26% reduction trails the 2008/09 38.6% drop and the 33.4% decline a year later on a percentage basis.
The question now is what these ending stocks will be in 18 months when the USDA releases its final supply-demand estimates for the 2018/19 marketing year in November 2019.
P[L1] D[0x0] M[300x250] OOP[F] ADUNIT[] T[]
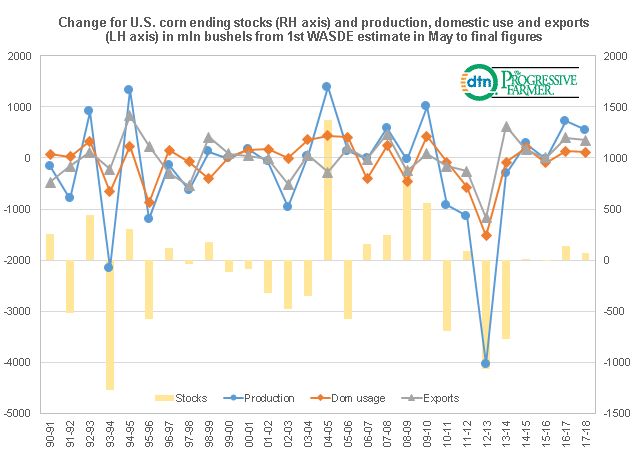
This graphic shows the change in U.S. corn ending stocks from the first WASDE report given in May to the final one for each marketing year furnished in November the following year plotted on the right hand axis in million bushels.
To answer why the stocks estimate was different we also plot the 18-month change in the production, domestic usage (feed/FSI) and exports on the left hand axis, also in million bushels.
Looking at the data, the biggest downside misses were in the 1993-94 season when final ending stocks were 1.268 billion bushels less than what the USDA had projected in May 1993 due to 1993 production 2.172 billion bushels less than what the USDA had projected ealrier due to heavy floods that year.
The November 2013 WASDE also showed ending stocks for the 2012/13 season 1.061 bln bushels less than the first WASDE projection for that marketing year given in May 2012 due to the devastating drought that season resulting in 2012 corn output 4.035 billion less than first predicted.
On the other hand, in the 2004-05 season, the final WASDE ending stocks was 1.373 bln bushels greater than foreseen 18 months earlier.
Production was 1.382 billion higher than had been projected, while in the 2008/08 season very expensive corn prices paring both domestic and foreign demand resulted in stocks 912 million bushels higher than had been estimated 18 months earlier.
Running correlations between the change in ending stocks 18 months later and the change in exports, domestic demand and production the figures are respectively 16.6%, 45.7% and 74.2%.
By far the change in corn production is the real reason why the final USDA ending stocks projection can vary so widely from the first to the last WASDE report for each marketing year.
(KA)
Comments
To comment, please Log In or Join our Community .