
Fundamentally Speaking
Corn Acreage Shifts From March Intentions to Final Crop Report
Two big reports coming up at end of month including the quarterly grain stocks and the prospective plantings and while both are important, with the markets increasingly focused on the new crop outlook we imagine that the planting intentions report will have the most influence.
Recall the government estimates are based primarily on surveys conducted during the first two weeks of March.
The March Agricultural Survey is a probability survey that includes a sample of over 84,500 farm operators selected from a list of producers that ensures all operations in the United States have a chance to be selected.
Keep in mind this is what producers say they "intend" to put in the ground though changing price scenarios, weather and other factors can result in large changes in what the final planted acreage is for each crop.
P[L1] D[0x0] M[300x250] OOP[F] ADUNIT[] T[]
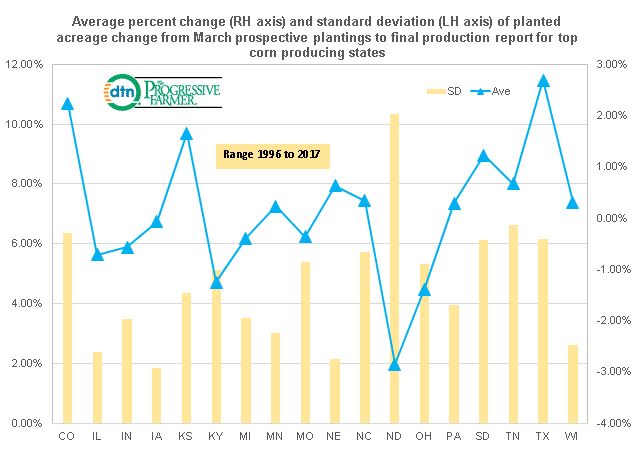
In this regard the attached graphic shows the percent change in planted corn acreage from the March intentions report to the annual crop production report that is released the following January on the right hand axis.
The standard deviation of these percent changes is on the left hand axis which is a measure of volatility with the range of data extending from 1996 to 2017 for the top 18 corn producing states.
As we have noted in a number of prior posts, corn seedings in North Dakota has really expanded over the past two decades based on superior returns vis-à-vis more traditional crops that used to be planted in that state along with higher yielding shorter season varieties.
Nonetheless, since they are located further north than any other top corn producing state actual planted acreage is more subject to the vagaries of weather as they have to wait longer for soil temperatures to warm up and also have an earlier first fall freeze date.
Therefore it is no surprise that North Dakota has the greatest average percent change in planted area from the March intentions report to the final crop production report where the final planted area has averaged 2.9% below the prospective plantings number.
They also have the highest standard deviation at 10.3% showing the greatest volatility in acreage shifts.
Other states having a likelihood of lower final acreage than what is indicated in March includes Kentucky where planted area averages 1.3% below March intentions and Ohio at down 1.4%.
With less likelihood of heavy spring rains in the Plains, the states of Colorado, Kansas and Texas on average have greater planted corn acres by the final crop report than what was indicated back in March.
Farmers in the number one and number three corn producing states of Iowa and Nebraska are most likely to stick with their original corn planting plans as evidenced by having the lowest standard deviations.
(KA)
© Copyright 2018 DTN/The Progressive Farmer. All rights reserved.

Comments
To comment, please Log In or Join our Community .