

Fundamentally Speaking
January Palmer Drought Conditions

Grain and oilseed markets have been pushing higher over the past few weeks supported by fund shortcovering, a depreciating U.S. dollar and the deteriorating crop situation in Argentina.
Also supportive has been growing drought conditions in the U.S. with the winter wheat crop already adversely impacted by serious dryness and some bouts of winterkill in recent weeks.
With the U.S. having scored good if not record row crop yields over the past five years there is some trepidation that this string of good fortune may soon run out and the latest U.S. Drought Monitor map feeds into this theory.
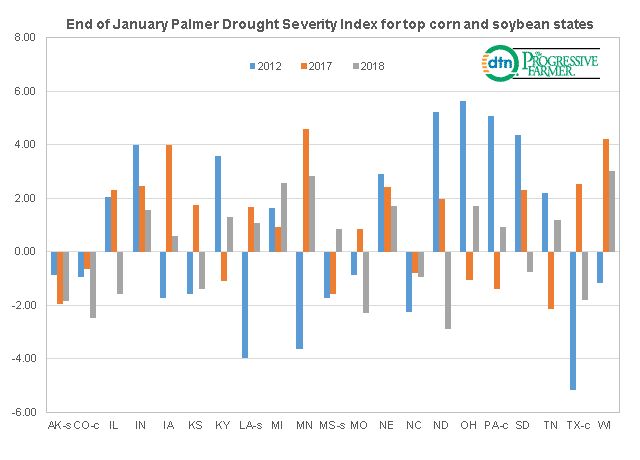
This graphic shows the Palmer Drought Severity Index (PDSI) for the top 21 corn and soybean producing states with 15 producing both while CO, PA and TX are just top corn states and AK, LA and MS are just top soybean producing states.
P[L1] D[0x0] M[300x250] OOP[F] ADUNIT[] T[]
As noted before in prior posts, the PDSI is the monthly value that is generated indicating the severity of a wet or dry spell.
This index is based on the principles of a balance between moisture supply and demand.
The index generally ranges from -6 to +6, with negative values denoting dry spells and positive values indicating wet spells.
There are a few values in the magnitude of +7 or -7. PDSI values 0 to -.5 =normal; -0.5 to -1.0 = incipient drought; -1.0 to -2.0 = mild drought; -2.0 to -3.0 = moderate drought; -3.0 to -4.0 = severe drought; and greater than -4.0 = extreme drought.
Similar adjectives are attached to positive values of wet spells.
The chart shows there are 12 states that have lower PDSI readings as of the end of January 2018 vs. the end of January 2012, a year in which U.S. crops were torched by one of the worst droughts in history.
Actually some of these states have positive PDSI readings meaning they are actually wet but not as wet as was seen six years ago.
The states really under the gun are those showing drought conditions of varying degrees including CO, IL, MO, ND and TX but that is less than the number of states showing drought conditions back in January 2012.
(KA)
Comments
To comment, please Log In or Join our Community .