

Fundamentally Speaking
USDA Long-Term Wheat Yield Projections

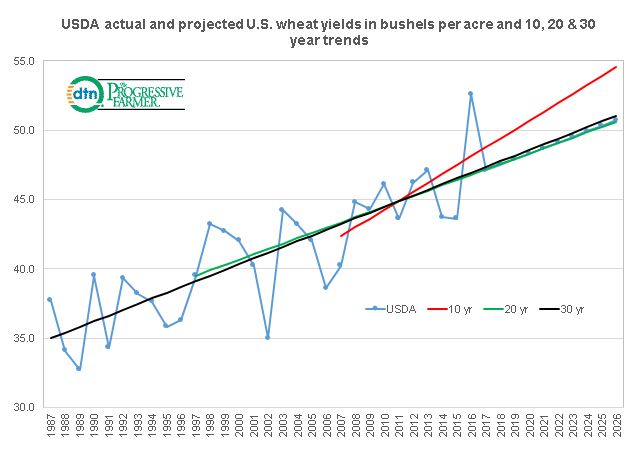
Similar to what we did with U.S. corn and soybean yields, this chart shows the actual and the long-term projected USDA all wheat yields as contained in the initial release of their Long-Term Agricultural Projections in bushels per acre (bpa) in blue along with the 30-year trend in black, the 20-year trend in green and the ten-year trend in red.
These are linear trends of the actual yields and are extended for another ten years going out to 2026 similar to what the USDA has done.
P[L1] D[0x0] M[300x250] OOP[F] ADUNIT[] T[]
The ten-year trend has yields increasing by 0.64 bushels per acre with the 20 year increasing at a rate of 0.38 bpa and the 30 year at 0.41 bpa per year.
The fact that the ten-year trend is so much higher than the 20 or 30 year trends is linked to the superlative performance seen in recent seasons especially this past year where the current projected record yield of 52.6 bpa is a whopping 12.1% above the 30-year trend topping all years since 1987 and the highest as a percent of trend since 1983.
Note that next year's yield is pegged at 47.1 bpa which is well below this year's new record of 52.5 bpa and some may see that as unrealistic.
By the end of the forthcoming ten-year period the final USDA projected yield is 50.7 bpa which is lower than the ten year 54.5 yield and the 30 year 51.0 yield though above the 20 year 50.6 yield which is the trend that most approximates the USDA projected all wheat yields from 2017 to 2016.
(KA)
Comments
To comment, please Log In or Join our Community .