

Fundamentally Speaking
History of Soybean Yield Changes

In a prior post we looked at the history of October to November U.S. corn yield revisions when the USDA had lowered its yield projection from the August to the September report and then again from the September to the October report as was the case this year.
This time we look at soybeans where this year the USDA increased its yield projection from the August to the September report and then again from the September to the October report.
P[L1] D[0x0] M[300x250] OOP[F] ADUNIT[] T[]
We looked at all years from 1965 to 2015 noting that there was no October 2013 USDA crop report due to the budget sequestration that year.
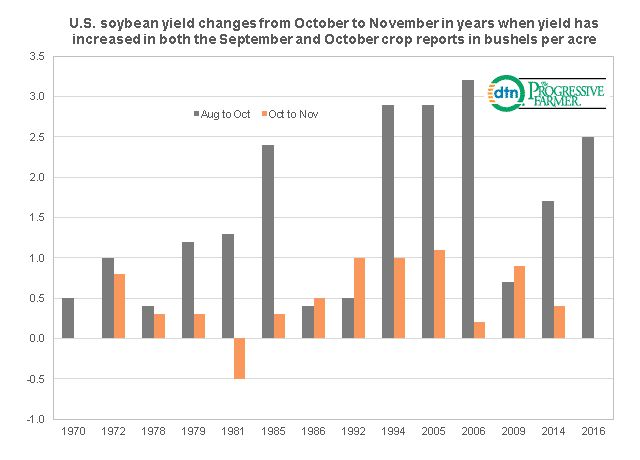
In this 50-year time span there were 13 occurrences besides this year where the USDA increased its U.S. soybean yield projection in the September and again in the October report and only one time, in 1981 did yields not increase again in the November report.
In the 14 years the average August to October cumulative yield gains were 1.5 bushels per acre (bpa) and the average increase from the October to November crop report in the 13 reported seasons was 0.5 bpa.
Furthermore, in years when yields have increased by at least 2.4 bpa from August to October (this year a 2.5 bpa advance) of which there were four occurrences all those years saw an October to November yield increase.
Given this historical trend and continued stellar field reports the odds seem high for an even larger 2016 U.S. soybean yield than the 51.4 bpa projection given by the USDA last week.
(KA)
Comments
To comment, please Log In or Join our Community .