
Fundamentally Speaking
Global Yield Records for Top Three Crops
In recent days we have seen some sort of nascent rally in the grain and oilseeds complex based in part on ample Midwest and Delta precipitation that in addition to causing harvest delays may lead to quality problems such as soybeans within the pods swelling and corn stalks rotting.
Additional supportive factors include early season concern about dryness in South America and an improved technical posture of the markets leading to some shortcovering in both corn and wheat.
P[L1] D[0x0] M[300x250] OOP[F] ADUNIT[] T[]
To be truthful there is not much real bullish news out there with the global situation equally as flush with supplies as that in the U.S. while consumption remains constrained by still subdued economic activity in Japan, Europe, China and South America.
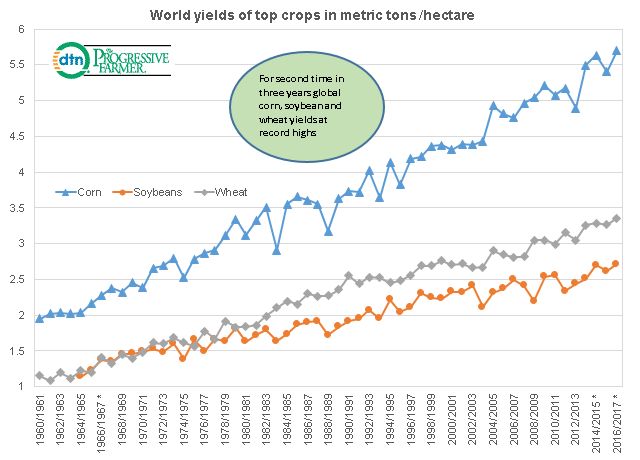
One of the main reasons for the rather hefty global situation include world yields for the top crops; corn, soybeans and wheat attaining new all-time highs for the second time in three years.
This graphic shows the global yields of the world's top crops include corn, soybeans and wheat in metric tons per hectare.
The USDA's Foreign Agricultural Services has harvested acreage and production data for corn and wheat going back to 1960 and 1964 for soybeans and from these we derive the various yields.
On the x-axis at the bottom those years in which all three crops attained new record high yields are denoted with an asterisk. There are just six occurrences including 1966/67, 1971/72, 1973/74, 1997/98, 2014/15 and this year's 2016/17 season.
So in 52, years there have only been six times this has happened and interesting like in the 1970's it occurs twice with the span of three seasons.
(KA)


Comments
To comment, please Log In or Join our Community .