

Fundamentally Speaking
Corn Crop Conditions vs. Yield Deviations
Once again the USDA surprised the trade by upping the corn crop condition ratings in week number 33 which corresponds to the third week in August.
Using a system where we weight the crop based on the percent in each category and assign that category a factor of 2 for very poor, 4 for poor, 6 for fair, 8 for good, and 10 for excellent and then sum the results, week 33 for 2016 is 774.
This is the fifth best since the USDA began compiling national and complete state ratings in 1986 and is exceeded only by the week 33 rating in 1986 of 838 (the highest ever), 786 in 1987, 790 in 1992, 798 in 1994 and 776 in 2004 and all of these years saw record yields averaging at least 10% above the 30 year trend.
P[L1] D[0x0] M[300x250] OOP[F] ADUNIT[] T[]
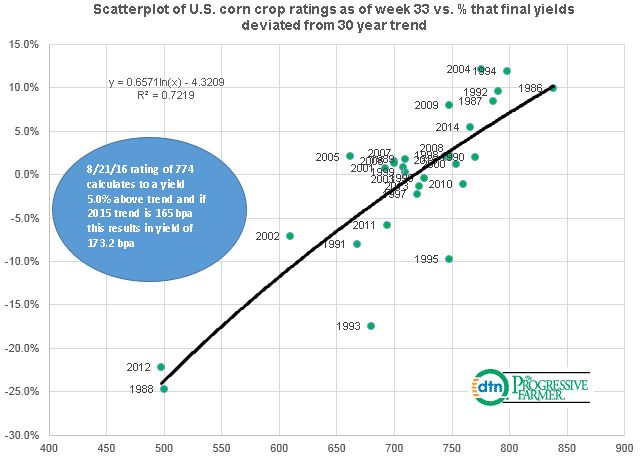
This graphic is a scatter-plot of week 33 U.S. corn crop ratings vs. the percent that final yields deviated from the 30 year trend.
We have included a logarithmic trend-line with an r squared that indicates that week 33 crop conditions explain about 72% of the variability in how final yields deviate from the 30 year trend.
We should note that the week 33 correlation between crop conditions and yields is about 85% which is the highest for any week during which the USDA puts out weekly crop conditions.
The equation for the trend line indicates that using a week 33 crop rating of 774 projects to a yield 5.0% above the 30 year trend which is 165 bushels per acre (bpa) which calculates to 173.2 bpa.
This is below the current USDA forecast though still above the prior record of 171.0 bpa set in 2014.
(KA)
© Copyright 2016 DTN/The Progressive Farmer. All rights reserved.

Comments
To comment, please Log In or Join our Community .