

Canada Markets
Percent Change in Seeded Acre Estimates for January Through April
For a second consecutive year, a change is being made in the way Statistics Canada compiles and releases its seeded acre estimates included in the Principal field crop areas report.
Historically, this report has been based on producer surveys conducted during the month of March, with 11,500 producers included in the survey, and results released in late April. The year 2020 was an exception, with results released in early May.
In 2023, the estimates were based on a survey of 9,500 producers in a Dec. 12, 2022, through Jan. 14, 2023, survey for the first time, allowing the statistics agency to collect other data at the same time, including Dec. 31 stocks. This report was released on April 26, which is the normal period for release. Concerns were expressed in the trade that the report may prove less accurate due to the early data polling and due to a smaller sample size.
P[L1] D[0x0] M[300x250] OOP[F] ADUNIT[] T[]
In 2024, Statistics Canada may have answered some concerns surrounding the time period between the survey period and the data release by releasing the report on March 11, more than a month earlier than the previous year and the normal period for this report. At the same time, this will fail to address concerns over the number of months involved between the survey period and actual planting in the spring.
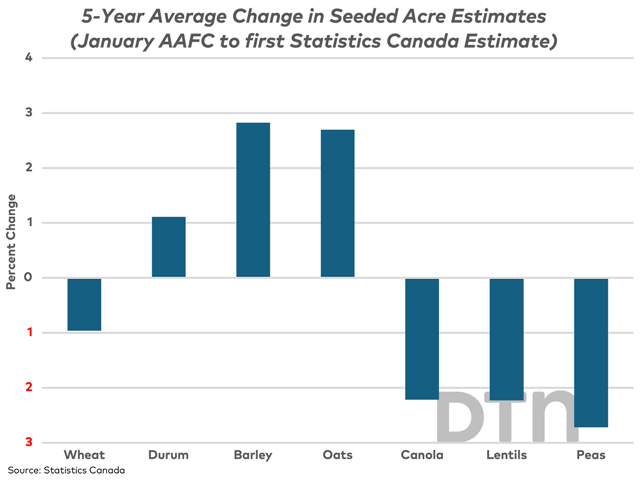
The attached chart shows the five-year average percent change in estimated acres from the unofficial estimate released by Agriculture and Agri-Food Canada in January to the first seeded area estimates from Statistics Canada released April/May.
On average, barley and oat acres show the largest upward revision over this period, calculated at 2.8% higher for barley and 2.7% higher for oats. The largest average lower revision is seen for dry peas with a 2.7% lower revision.
According to Statistics data, the seeded acre estimate for the largest crops of wheat and canola tend to be revised lower in the spring on average.
Cliff Jamieson can be reached at cliff.jamieson@dtn.com.
Follow him on X, formerly known as Twitter, @CliffJamieson.
(c) Copyright 2024 DTN, LLC. All rights reserved.

Comments
To comment, please Log In or Join our Community .