Canada Markets
Canola Exports Trail Forecast Pace
Canola exports continue to disappoint with week 26 licensed exports reported at 61,100 metric tons (mt), the largest in three weeks. This was well below the 184,300 mt needed for the week to stay on track to reach the current AAFC forecast of 7.7 million metric tons (mmt). Weekly exports have fallen below 100,000 mt/week in five of the past six weeks, with the four-week average at 69,300 mt (week 23-26).
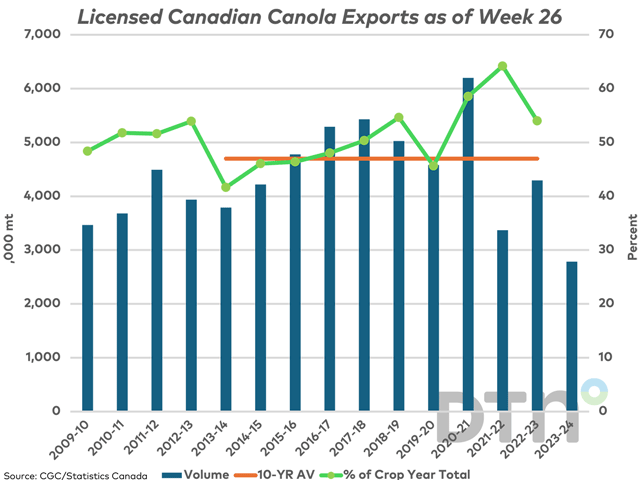
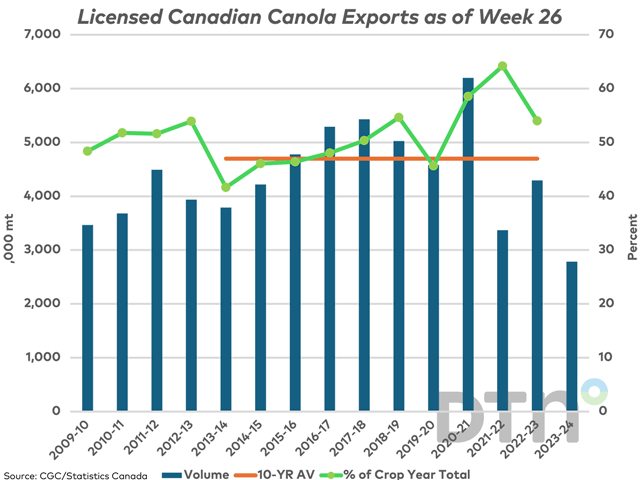
Canada's cumulative licensed exports of canola are reported at 2.7844 mmt over the first half of 2023-24, down 1.510 mmt from the same period in 2023-24 and 1.9 mmt below the 10-year average, as indicated by the horizontal brown line on the accompanying chart. This volume is more than 1 mmt behind the steady pace needed to reach the current AAFC forecast of 7.7 mmt for 2023-24. Since week 20, cumulative exports of canola have lagged the cumulative volume of soybeans shipped, with cumulative soybean exports reported just over 3 mmt.
The concern is that grain doesn't necessarily flow at a steady pace; in the case of canola, total exports tend to be weighted to the first half of the crop year. As seen with the green line with markers on the chart, measured against the secondary vertical axis, licensed crop year exports as of week 26 in 2022-23 reached 54% of the crop year's total exports, as high as 64.2% in 2021-22 while averaging 55.4% over the past five years. This pace of movement projects forward to roughly 5 mmt for 2023-24, well below the current 7.7-mmt forecast.
P[L1] D[0x0] M[300x250] OOP[F] ADUNIT[] T[]
Commercial inventory in week 26 rose to 1.0059 mmt, down 17.8% from one year ago and down 31.3% from the three-year average for this week. Current official estimates show crop-year supplies very close to the volume reported for the previous year. If the estimates are accurate: 1) Producers are slow to come to market; or 2) Buyers are slow to do what is needed to attract them.
There are rumors China has been a buyer lately, although Dow Jones commentary on ProphetX has an unidentified trader stating, "There's a decent lineup of boats in Vancouver destined for China; but it's a lot lower than they would be for this time of year."
Competition from Australia remains a factor. A ProphetX chart showing prices for Canadian and Australian price data FOB China's ports (in USD) shows a $73.50/mt USD advantage for Australia product, although this has fallen by $/mt this week to the lowest level in roughly two months.
European data shows no Australian canola imported over the past two weeks, while European commentary reports the Red Sea blockade has substantially increased Australia's freight costs into Europe, which bears watching.
The March canola contract fell $9.10/mt Friday to $592.10/mt, while falling $32.10/mt over the week for the largest weekly loss in four weeks, closing below psychological support of $600, which could lead to increased selling.
CFTC data as of Jan. 30 shows both commercial and noncommercial traders holding relatively close to the record net-short position held by noncommercials for the week ended Jan. 16 and the record net-long held by commercial traders for the same week. Very little change was seen in these positions over the week ended Jan. 30 as traders remain entrenched in their positions.
Cliff Jamieson can be reached at cliff.jamieson@dtn.com.
Follow him on X, formerly known as Twitter, @CliffJamieson.
(c) Copyright 2024 DTN, LLC. All rights reserved.


Comments
To comment, please Log In or Join our Community .