

Canada Markets
European Durum Imports Show a Potential Shift

There is ongoing speculation that durum exports from Turkey have run their course, while Russia's government has taken steps to temporarily ban exports through the end of May to protect domestic supplies.
Weekly European Union import data as of Jan. 8 shows a potential shift in where their durum imports originate over recent weeks, which bears watching.
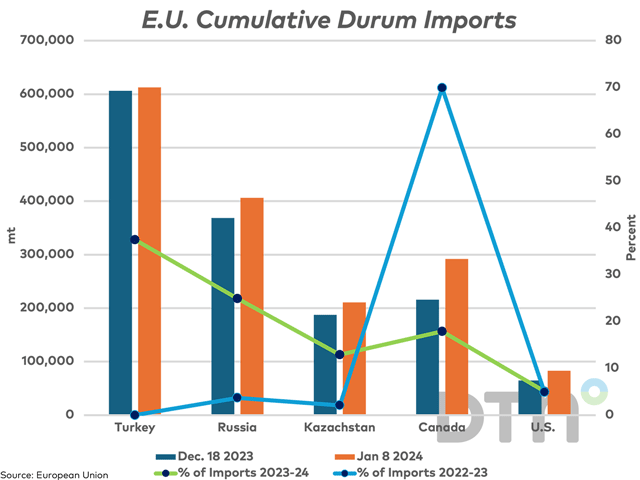
The blue bars on the attached chart show the cumulative volumes of durum imported based on the country of origin as of their week 26, or Dec. 18. These volumes are compared with the cumulative volumes as of Jan. 8.
P[L1] D[0x0] M[300x250] OOP[F] ADUNIT[] T[]
While cumulative volumes imported increased across all countries shown between these two dates, the increase was a modest 6,200 metric tons (mt) from Turkey, 17,988 mt from the United States, 23,282 mt from Kazakhstan, 37,554 mt from Russia and 76,194 mt from Canada. It has taken some time, but the pendulum may be swinging to North American supplies until new-crop availability.
The two lines on the chart indicate the share of total imports from each country as of Jan. 8, with the green line representing the current crop year while the blue line represents these percentages one year ago.
While not shown, over the recent weeks from Dec. 18 to Jan. 8, Turkey's share has fallen by 3.8 percentage points to 37.5% and the Russian share has fallen by .2 percentage points to 24.9%. The Kazakhstan share has increased .1 percentage points to 12.9%, the U.S. share by .7 percentage points to 5.1% and the Canadian share has improved by 3.2 points to 17.9%.
As is seen on the attached chart, Canada's loss in year-over-year share, a drop in 52 percentage points, has resulted in a gain for Turkey (37.5 percentage points), Russia (21.2 percentage points) and Kazakhstan (10.8 percentage points).
While it bears watching, E.U. durum imports as of their week 28 are more than double the volume imported over this period over each of the past two years, or 1.635 million metric tons as compared to 811,532 mt in 2022-23 and 840,228 mt in 2021-22. Their import program will likely prove front-loaded and their needs over the balance of the crop year may be limited when compared to past years.
Cliff Jamieson can be reached at cliff.jamieson@dtn.com.
Follow him on X, formerly known as Twitter, @CliffJamieson.
(c) Copyright 2024 DTN, LLC. All rights reserved.
Comments
To comment, please Log In or Join our Community .