

Canada Markets
January Canola Higher in Active Trade
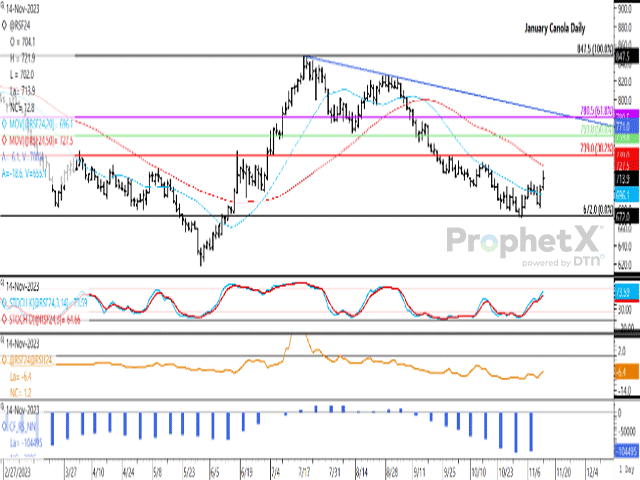
January canola extended Friday's gains on Tuesday, gaining $12.80/mt to close at $713.90/mt, its highest close in 18 sessions. Friday's move saw the January canola contract post a weekly gain for the first time in four weeks, ending $8.80/mt higher over the week, while printing a weekly close above $700/mt for the first time in three weeks. Friday's session also resulted in a bullish outside bar on the daily chart, while ending the week above the contract's 20-day moving average.
Today's move was realized in active trade of 34,642 contracts in the January contract, the highest daily volume in 17 sessions while the second-largest daily volume seen over the life of the January contract.
After being closed for trade on Monday, the January contract has reached a three-week high, moving closer to resistance at the contract's 50-day moving average at $727.50/mt, which hasn't been tested since the support of the 50-day was breached on Sept. 7.
P[L1] D[0x0] M[300x250] OOP[F] ADUNIT[] T[]
Further resistance is seen at October highs, which range from $728/mt to $732.60/mt, while the contract's 50-day moving average lies nearby at $727.50/mt, a resistance line that has not been tested since Sept. 7.
The brown line in the middle study shows the January/March futures spread narrowing to minus $6.40, the narrowest seen since Oct. 17 or close to one month. When compared to this date during the past five years, this is the first time in three years that this spread has not been inverted on this date, while the five-year average is plus $4.50/mt, or the January trading over the March contract.
The blue bars of the histogram in the lower study shows what may be the start of nervous noncommercial activity. As of Oct. 31, noncommercial or speculative traders held a bearish net-short futures position of 107,481 contracts, the largest bearish position on record. Over the week ending Nov. 7, this group pared this bearish position by a modest 2,986 contracts, the first sign of a change in sentiment in eight weeks. While not shown, the noncommercial short chart in ProphetX shows this short position falling for the first time in 13 weeks from the record large position shown for the previous week.
We have long pointed to this large net-short position to potentially lead to market volatility should investors trading from the short side grow nervous.
Ahead of the Nov. 15 NOPA data release in the U.S., pre-report estimates are expecting a record crush for any month to be reported for October, signaling continued strong demand for soybeans. As well, a change in the weather pattern for Brazil is expected to shift showers into central regions of the country starting late this week, and this bears watching.
Cliff Jamieson can be reached at cliff.jamieson@dtn.com
Follow him on X, formerly known as Twitter, @CliffJamieson
(c) Copyright 2023 DTN, LLC. All rights reserved.

Comments
To comment, please Log In or Join our Community .