

Canada Markets
Dec. 31 Canadian Grain Stocks Released

It is no surprise that Statistics Canada's Dec. 31 grain stocks were reported higher than one year ago, with a sharp rise in production achieved in 2022 following drought conditions in the previous year. Of the largest crops shown on Statistics Canada's chart, stocks rose by 27.7% to 62.181 million metric tons (mmt).
Stocks of all-wheat in the country rose 32.6%, to 22.294 mmt, while 5.2% below the five-year average. This is the second-lowest stocks seen in the past seven years.
Wheat stocks (excluding durum) rose 30.2% from one year ago to 18.599 mmt, while 2.4% below the five-year average. At 15.172 mmt, farm stocks rose 38.3%, to 15.172 mmt, while are still the second-lowest stocks seen in six years and below the five-year average of 15.654 mmt. Over the past five years, the January-through-July disappearance has averaged 14.560 mmt, which would lead to ending stocks just slightly lower than is currently forecast by Agriculture and Agri-Food Canada (AAFC). Wheat stocks as a percent of crop year supplies are calculated at 59%, up 1% from one year ago while below the five-year average of 62%.
Durum stocks were reported at 3.695 mmt as of Dec. 31, up 45.9% from the previous year while 17.4% below the five-year average. By one industry account, this was below the level of pre-report estimates, while the second-lowest stocks seen in 15 years. During the past five years, an average of 3.4 mmt has disappeared during the January-to-July period, while this average pace of movement would tighten stocks to a level slightly below the current AAFC forecast. Durum stocks as a percent of crop year supplies are calculated at 61.4%, down from 66% one year ago, while below the five-year average of 69%.
P[L1] D[0x0] M[300x250] OOP[F] ADUNIT[] T[]
Canola stocks were estimated at 11.356 mmt, up 29.3% from one year ago while 15.9% below the five-year average for this date. This is the second-lowest stocks seen in the past 10 years. Farm stocks swelled by 42.3% to 9.741 mmt, while remained 2 mmt or 17% below the five-year average for this date. The average disappearance during the January-to-July period over the past five years is 10.873 mmt, which would result in stocks that are slightly higher than the current AAFC forecast. Canola futures have traded both sides of Monday's close since the release of this forecast, struggling for direction. Canola stocks as a percent of crop year supplies are calculated at 59.5%, up from 56.2% one year ago while below the five-year average of 61.2%.
Barley stocks of 5.072 mmt are up 60.9% from one year ago while 1.2% below the five-year average and the third lowest stocks reported for this date in the past 20 years. Domestic use appears to be roughly 848,000 metric tons higher than the same five-month period in 2021-22 due to increased availability, which has sharply reduced the need for imported corn. Over the past five years, use over the January-through-July period averages 4.277 mmt, which would lead to tighter stocks than is currently forecast by AAFC, which is bullish for this market. Barley stocks as a percent of crop year supplies are calculated at 48%, up from 40% one year ago while below the five-year average of 50%.
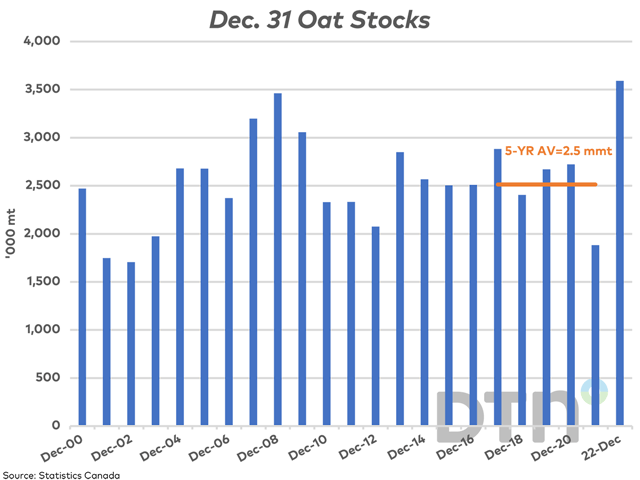
Oat stocks jumped sharply higher during the past year to a record 3.591 mmt as of Dec. 31, up 90.8% from one year ago and 42.9% higher than the five-year average. Once again, it was the jump in farm stocks that were most evident, up 108% to 3.3 mmt as of Dec. 31, also a record volume and 1.047 mmt or 46.5% higher than the five-year average. During the past five years, an average of 2 mmt has disappeared during the January-to-July period of the crop year, which would lead to ending stocks that are significantly higher than the current AAFC forecast. Oat stocks as a percent of crop year supplies are calculated at 64.4%, up from 52.6% one year ago while above the five-year average of 57.2%. This report is viewed as bearish for oats.
Lentil stocks were reported at 1.439 mmt for Dec. 31, up 18.7% from one year ago while 27.3% below the five-year average. This is the third-lowest December stocks reported in 13 years. Over the past five years, an average of 1.463 mt has disappeared during the January-to-July period; lentils are on their way to pipeline-stocks by the end of the crop year as is currently forecast by AAFC.
Dry pea stocks were reported at 2.115 mmt as of Dec. 31, up 32.8% from one year ago while down 15% from the five-year average. This is the third-lowest stocks reported for this date in 15 years. Over the past five years, an average of 2.065 mmt has disappeared during the January-to-July period, signaling that even average movement over the remainder would lead to tighter stocks than currently forecast by AAFC.
Soybean stocks as of Dec. 31 were reported at 3.654 mmt, up 14% from one year ago and 6% lower than the five-year average. Even an average pace of movement will tighten stocks to tight levels, as currently forecast by AAFC. Over the past five years, an average of close to 3.4 mmt has disappeared during the January-to-July period.
Corn stocks as of Dec. 31 were estimated at 11.862 mmt, up 2.9% from Dec. 31, 2021, while 3.4% higher than the five-year average. This is the highest stocks reported in five years. As a percentage of total crop year supplies, Dec. 31 stocks are at 68.7%, up sharply from 50.3% last year while above the five-year average of 61%.
Cliff Jamieson can be reached at cliff.jamieson@dtn.com
Follow him on Twitter @Cliff Jamieson
(c) Copyright 2023 DTN, LLC. All rights reserved.
Comments
To comment, please Log In or Join our Community .