

Canada Markets
Statistics Canada's Historical Production Revisions

On Dec. 16, Agriculture and Agri-Food Canada is scheduled to release its December Canada: Outlook for Principal Field Crops report. In this report, supply and demand tables will be revised to include the latest changes in the production estimates released by Statistics Canada on Dec. 2, while based on November surveys conducted with producers.
Despite this report being the last official production estimate released for the crop year, Statistics Canada states that production estimates are subject to revision for a two-year period.
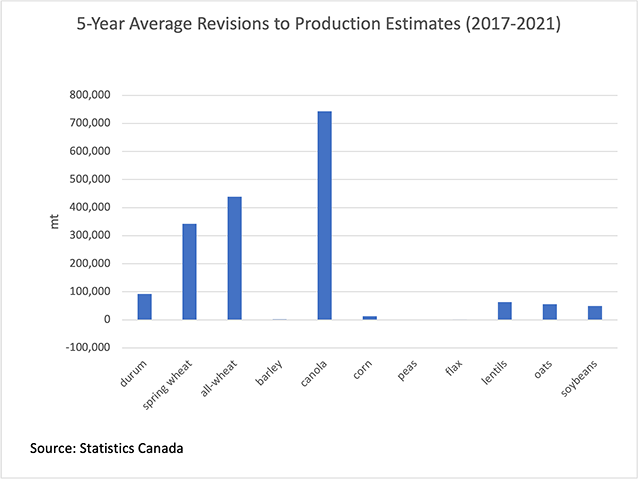
The question is, to what extent do these revisions take place in the two years following the November estimates? As seen on the attached chart, revisions are rather insignificant for the majority of the principal field crops, but are common in the largest crops of wheat and canola during the past five years.
P[L1] D[0x0] M[300x250] OOP[F] ADUNIT[] T[]
During the past five years (2017-2021), there were two modest upward revisions made to the durum estimate along with one larger increase of 384,290 metric tons (mt) seen for the 2021 crop. This is calculated by looking at the December release of the November estimates each year, while comparing to the current volume reported for each year by Statistics Canada. During the past five years, the durum estimate has been revised higher by an average 92,899 mt.
A larger increase has been seen for the spring wheat estimate. This estimate has been revised higher in each of the past five years, with the revision ranging from 241,400 mt for the 2020 crop to a high of 542,200 mt for the 2018 crop. The five-year average points to a 341,947 mt increase in the spring wheat estimate.
The largest revisions seen for all crops is found in the canola data. The canola production estimate has been revised higher in each of the past five years following the November estimate release, while in excess of 1 million metric tons (mmt) in two of the years, as high as 1.263 mmt in 2019. The five-year average increase is 743,200 mt.
Will this year be different for canola? Statistics Canada revised its production forecast lower by roughly 925,000 mt, with estimates falling closer in line with estimates reported in provincial government crop estimates. At the same time, Dow Jones commentary on ProphetX indicated the industry that was polled was split on whether Statistics Canada would revise its production forecast higher or lower when it reported on Dec. 2.
Cliff Jamieson can be reached at cliff.jamieson@dtn.com
Follow him on Twitter @Cliff Jamieson
(c) Copyright 2022 DTN, LLC. All rights reserved.
Comments
To comment, please Log In or Join our Community .