

Canada Markets
December Spring Wheat reaches its Lowest Close in one Month
One doesn't have to look far for supportive news in the wheat market. According to the USDA's October WASDE data, global wheat stocks for 2022-23 (excluding China) are currently forecast to reach their lowest level in 15 years at 123.176 million metric tons. The same can be said for the forecast for U.S. hard red spring wheat stocks, which are also forecast to reach their lowest level in 15 years.
This week, we see reports of heavy rains seen for eastern Australia, which may prove detrimental for crop quality, while a USDA attache report for Argentina has cut prospects for that country's wheat crop from the official estimates released by the USDA. Russia's final decision on whether to end or extend the deal that allows Ukraine grain to flow through three export ports into export channels on the Black Sea remains uncertain, while we do know that Ukraine's winter wheat planting will be down sharply this fall.
As seen on the attached chart, the best the spring wheat market can muster is an overall sideways move, with this week's trade consolidating within the previous week's range. While not shown, stochastic momentum indicators on the weekly chart are seen turning sideways, while near the middle of the neutral zone on the chart.
P[L1] D[0x0] M[300x250] OOP[F] ADUNIT[] T[]
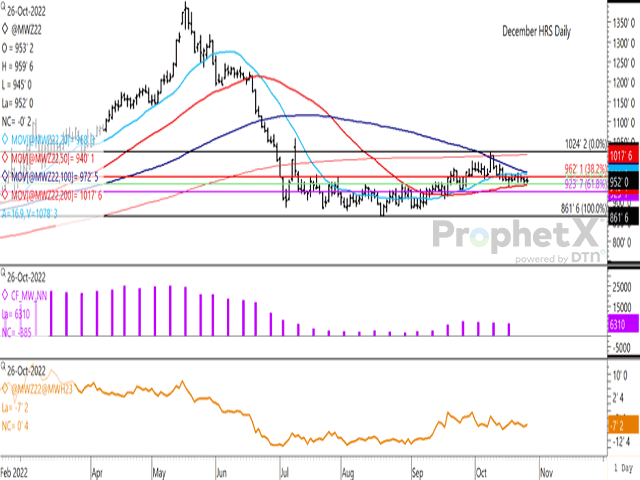
The December contract closed lower for a fourth session on Wednesday, diverging from the higher closes seen for December hard red winter wheat and soft red winter wheat. After closing 1/4 cent lower at $9.52/bu on Wednesday, the December contract has reached its weakest close in one month. The session's trading range formed a bearish outside bar on the daily chart, trading both higher and lower than the range traded on Tuesday.
Support on the chart may continue at $9.43/bu, the 50% retracement of the move from the August low to the October high, with buying interest at or near this level appearing in three of the past seven sessions. Another supportive feature is the stochastic momentum indicators on the daily chart (not shown), which are seen dipping into over-sold territory, which may soon act to slow noncommercial selling interest.
The histogram bars on the first study show the noncommercial net-long position falling in each of the past three weeks, while this week's report as of Oct.24 could result in a fourth week of a declining net-long position.
The lower study shows the Dec/March spread ranging from minus 3 cents to minus 8 cents since mid-September, with today's close of minus 7 1/4 cents, near the lower end of the range.
Cliff Jamieson can be reached at cliff.jamieson@dtn.com
Follow him on Twitter @Cliff Jamieson
(c) Copyright 2022 DTN, LLC. All rights reserved.

Comments
To comment, please Log In or Join our Community .