

Canada Markets
CGC Data Signals a Slow Start to Crop Year Movement
Week 5 Canadian Grain Commisssion data shows western terminal unloads of all grain (Vancouver, Prince Rupert, Churchill and Thunder Bay) for the week ending Sept. 4 at 359,300 metric tons. This is up only 26,800 mt from the previous week, despite the advancing prairie harvest, while above the four-week average of 282,225 mt. To put in perspective, week 5 unloads in 2021-22 were 403,000 mt, while the five-year average for this week is 574,060 mt.
A combination of a slower start to harvest, tighter old-crop stocks and perhaps even weak export demand has led to a slow start to grain movement. As of week 4 data, demand for hopper cars by the major shippers totaled 14,164 cars, down from 16,140 ordered during the same period in 2021-22 and the three-year average of 24,240 cars. This data should be updated to include week 5 activity later today.
P[L1] D[0x0] M[300x250] OOP[F] ADUNIT[] T[]
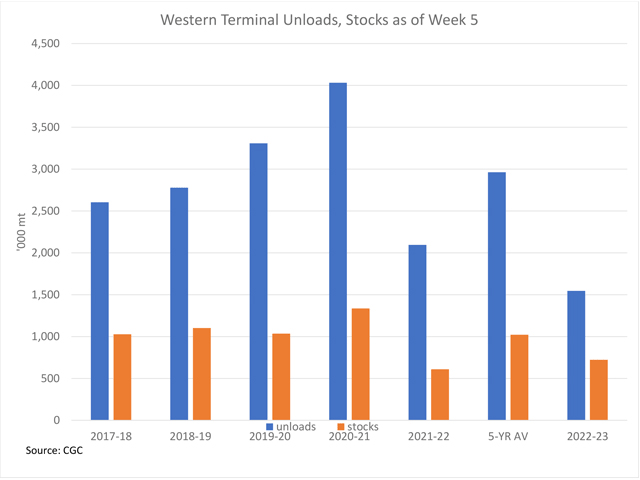
As seen on the attached chart, cumulative unloads at the western terminals total 1.5455 million metric tons, down 26.2% from the previous crop year and 47.9% below the five-year average. The five-year high is 4.0316 mmt during this period, achieved in 2020-21.
As seen by the brown bars on the attached chart, western terminal stocks are reported at 722,500 mt in week 5, up 18.6% from the same week last crop year while 29.3% below the five-year average for this period. This represents just 26.3% of total estimated capacity and 37.5% of the estimated working capacity, with capacity estimates calculated by the Grain Marketing Program.
Favourable data is seen in the AG Transport Coalition Daily Network Status as of Sept. 7, or early in week 6, with cumulative data for the week showing West Coast unloads averaging 600 cars/day, up 54% from the same period a week prior, while Thunder Bay unloads averaged 128, a modest 3% increase from the previous week.
With winter months ahead, Canada's two major railways will be pressured to perform in a compressed time period in order to achieve the recovery in exports currently forecast by government.
Cliff Jamieson can be reached at cliff.jamieson@dtn.com
Follow him on Twitter @Cliff Jamieson
(c) Copyright 2022 DTN, LLC. All rights reserved.

Comments
To comment, please Log In or Join our Community .