

Canada Markets
Saskatchewan Harvest at Average or Even Better Pace
As seen in Saskatchewan Agriculture's weekly Crop Report, as of Aug. 22, hot and dry weather has led to rapid harvest progress during the past week in the southern and western side of the province, while the eastern side saw a slower pace of activity as showers slowed crop maturity and harvest progress.
An estimated 45% of the Southeast Region is harvested as of Aug. 22, up 28 percentage points from the previous week. An estimated 19% of the West-Central Region is harvested, up 11 points over the previous week. The percentage of the Southeast Region viewed as harvested is at 6%, up four points, and the estimate for the East-Central Region increased three points during the week to 4% complete. The estimates for the Northeast and Northwest Regions increased by one point to 1% complete as of Aug. 22.
P[L1] D[0x0] M[300x250] OOP[F] ADUNIT[] T[]
Hotter and drier conditions will benefit the eastern side of the province, while this is exactly what is seen in the current forecast, with daytime highs during the next five days reaching 4-9 degrees Celsius above normal.
It is also interesting to note that when comparing current progress to the five-year average, the Southwest Region is 16 points ahead of average for the region, while the Southeast Region is 14 points behind average. The West Central Region is 6 points ahead of average, while the East-Central is 5 points behind average. Across the north, the Northwest Region is 3 points behind average and the Northeast is 6 points behind average.
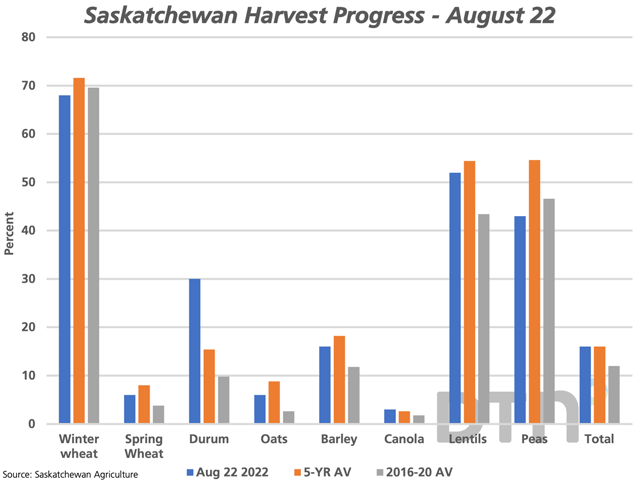
The total harvest progress for all crops is viewed at 16% complete, which is equal to the five-year average, as seen on the attached chart. It is interesting to note that of the crops selected, when compared to the five-year average, only durum and canola are ahead of their five-year average pace (2017-21), while other crops show progress trailing the average pace.
At the same time the 2021 crop matured quickly due to heat and drought, while allowed for faster progress while in the field due to sharply lower yields. When current progress is compared to the five-year average from 2016-20, as shown by the grey bars on the attached chart, we see that the total progress of 16% is ahead of the 2016-20 average of 12%. Given this comparison, the current progress for both winter wheat and dry peas would trail the average pace over 2016-20, while progress across all other selected crops would be ahead of the average pace for the five years.
Cliff Jamieson can be reached at cliff.jamieson@dtn.com
Follow him on Twitter @Cliff Jamieson
(c) Copyright 2022 DTN, LLC. All rights reserved.

Comments
To comment, please Log In or Join our Community .