

Canada Markets
November Canola has a Great Day but Sideways Overall
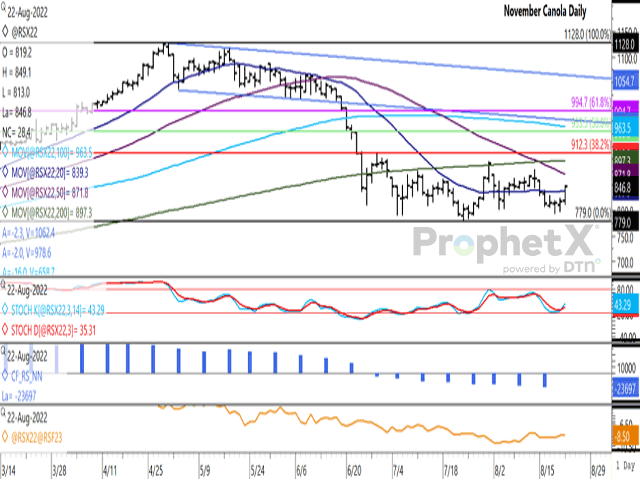
November canola settled at $846.80/metric ton on Monday, up $28.40/mt, while just $0.95/mt above the mid-point of the $133.70/mt range traded over the past eight weeks. Today's gain was the largest one-day move seen this month, while ending above the contract's 20-day moving average at $839.30/mt for the first time in five sessions.
Resistance lies at the psychological $850/mt, the 50-day moving average at $871.80/mt and the 200-day moving average at $897.30/mt. Further psychological resistance lies at $900/mt, while the upper end of the eight-week range is seen at $912.70/mt. This level is close to the 38.2% Fibonacci retracement level of $912.30/mt.
P[L1] D[0x0] M[300x250] OOP[F] ADUNIT[] T[]
The first study of the attached chart shows a turn higher for the stochastic momentum indicators, although it is not the most bullish of crosses which take place in the oversold region of the chart, or below 20%. Momentum indicators have spent little time in either oversold or overbought regions of the chart since early May.
The second study shows the CFTC's most recent data that highlights the noncommercial net-short position in canola futures reaching 23,697 contracts net-short as of Aug. 16. This is the sixth increase in this bearish position in seven weeks, while the largest bearish position seen since July 2020, or more than two years.
The lower study shows the Nov/Jan spread closing unchanged on Aug. 22 at minus $8.50/mt. This is down from the $11.50 inverse shown this time last year (Nov above the Jan), while compares to the five-year average of minus $3.14/mt. If you remove the 2021-22 spread, which was a direct result of the 2021 drought, the 2016-17 through 2020-21 five-year average is minus $6.74/mt.
Cliff Jamieson can be reached at cliff.jamieson@dtn.com
Follow him on Twitter @Cliff Jamieson
(c) Copyright 2022 DTN, LLC. All rights reserved.

Comments
To comment, please Log In or Join our Community .