Canada Markets
Canada's Week 51 Wheat Exports Show a Late-Year Push
The Canadian Grain Commission reports week 51 all-wheat exports, activity for the week ended July 24, at 455,300 metric tons (mt), which includes 394,600 mt of wheat and 60,700 mt of durum. This is the third highest weekly volume of wheat (excluding durum) shipped so far this crop year, with exports of wheat exceeding 400,000 mt in both week 1 and week 4.
When combined, all-wheat exports are the second highest achieved over the crop year, next to the 568,300 mt shipped in the first week of the crop year. Despite total estimated supplies of durum that are down 53% this crop year and total estimated supplies of wheat down 27.7%, or 13.186 mmt in total based on AAFC's supply and demand tables, shippers are still able to pull off a late crop year push to move grain out.
P[L1] D[0x0] M[300x250] OOP[F] ADUNIT[] T[]
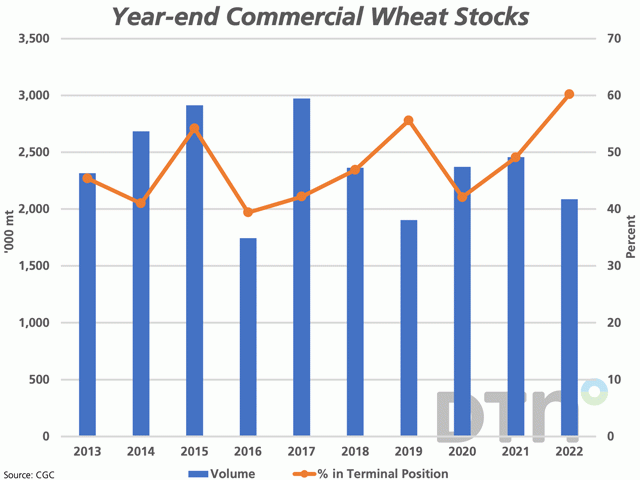
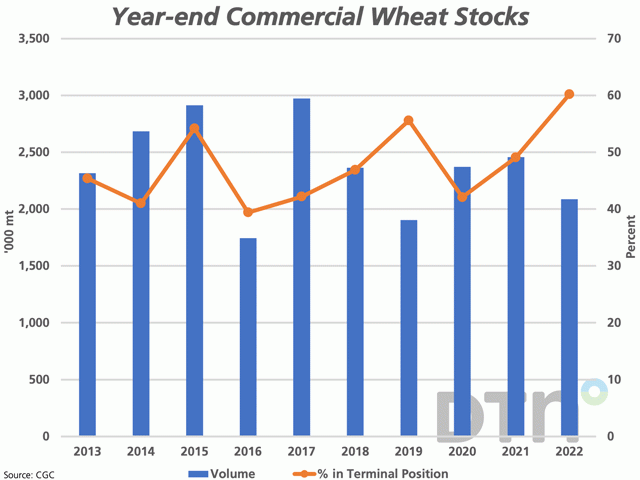
While new crop cannot come soon enough, the aggressive push seen in week 51 could continue. As seen on the attached graphic, commercial wheat stocks (excluding durum) were reported at 2.0873 mmt in week 51. This is down 15.1% from the year-end or week 52 inventory in 2020-21, but when compared to historical year-end inventory, is the smallest volume reported in only three years.
In addition, the brown line with markers represents the percentage of these stocks found in terminal position, found by subtracting the primary elevator stocks and the process elevator stocks. This is calculated at 60.2% in week 51, indicating we have the highest percentage of commercial stocks found in terminal position seen over the 10-year period shown.
Week 52 data should result in a similar finding; the AG Transport Coalition's Daily Network Status Report shows that as we near the end of week 52, the average daily West Coast unloads so far this week are reported at 385 cars/day, up 7% from the previous week.
Cliff Jamieson can be reached at cliff.jamieson@dtn.com
Follow Cliff Jamieson on Twitter @Cliff Jamieson
(c) Copyright 2022 DTN, LLC. All rights reserved.


Comments
To comment, please Log In or Join our Community .