
Canada Markets
Grain Shippers and Railways Combine for Positive Results
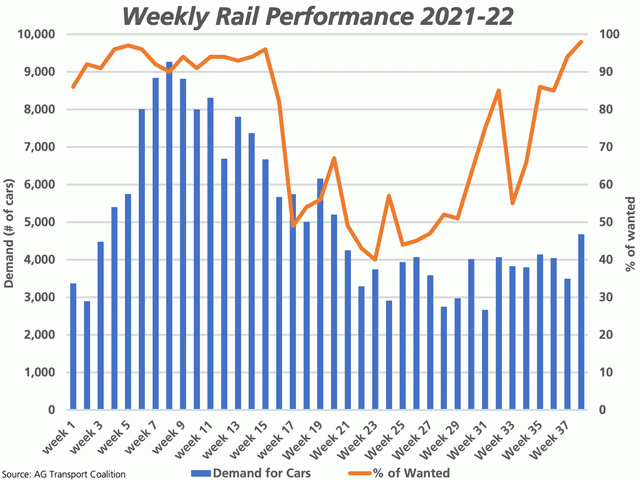
The blue bars on the attached chart represent the weekly demand for railcars for loading each shipping week by the major grain shippers on the Prairies, as reported by the AG Transport Coalition, a group that covers 90% of the grain movement from Western Canada.
In week 38, or the week ending April 24, this demand hit 4,677 hopper cars, the highest number seen in 18 weeks and compares to the previous four-week moving average of 3,870 cars. This remains well-below the 8,694 cars in demand for the same week last crop year and the three-year average of 9,468 cars.
P[L1] D[0x0] M[300x250] OOP[F] ADUNIT[] T[]
By shipping corridor, this demand is seen at 2,690 cars or 57.5% of the total destined for the West Coast (2,107 cars) and 1,455 cars or 31% of the total destined for Thunder Bay (1,145 cars), with the four-week average for each shipping corridor in brackets.
The line with markers represents the weekly percentage of the hopper cars that are spotted in the week wanted, or the fulfillment rate. In the latest week, or week 38, the two major railways spotted a combined total of 98% of the cars wanted for loading, which is the best weekly performance achieved this crop year. Performance was also consistent, with both CN and CP each spotting 98% of the cars wanted over the week.
Primary elevator stocks across the Prairies are reported at 3.835 million metric tons, down 5.4% from the same week last crop year and down 4.3% from the three-year average for this week. Manitoba stocks are down 15.8% from the three-year average, signaling an aggressive push in movement to Thunder Bay, while British Columbia stocks are 2.6% below average, Saskatchewan stocks are 2.5% below average and Alberta stocks are just 0.2% below average. This should allow continued favorable movement during the upcoming weeks as the focus shifts to fieldwork.
Cliff Jamieson can be reached at cliff.jamieson@dtn.com
Follow him on Twitter @Cliff Jamieson
(c) Copyright 2022 DTN, LLC. All rights reserved.

Comments
To comment, please Log In or Join our Community .