Canada Markets
Statistics Canada's Dec. 31 Grain Stocks
The Feb. 8 release of Statistics Canada's grain stocks as of Dec. 31 provides a glimpse of disappearance during the first five months of the crop year (four in the case of corn and soybeans). There is no surprise that stocks are sharply lower, while this report will provide insight to the pace of demand while sending signals as to how Canada is positioned for the remainder of the crop year.
According to today's report, stocks of all principal field crops total 46.677 million metric tons as of Dec. 31. This is down 20.8 mmt or 30.8% from Dec. 31, 2020, the lowest stocks since Dec. 31, 2003, while the largest year-over-year percentage drop seen in Statistics Canada data going back to 1982.
Canada's all-wheat stocks are estimated at 15.564 mmt, down 37.8% from last year and 37.5% below the five-year average of 24.9 mmt. This volume is well-below expectations, with social media posts indicating a trade expectation of 17.3 mmt to 17.9 mmt. This is the smallest all-wheat stocks estimated since December 2002.
When wheat is broken down further, wheat (excluding durum) stocks are reported at 13.470 mmt, down 33.4% from last year and 31.7% from the five-year average of 19.7 mmt. This volume is only slightly higher than the 13.334 mmt estimated for Dec. 31, 2007. Disappearance during the first five months totals 44% of the estimated supplies, well-above the five-year average of 37% over this period. Based on the Canadian Grain Commission's week 22 statistics, cumulative disappearance totaled 6.912 mmt over 22 weeks. Outstanding forecast demand of 14.2 mmt plus forecast ending stocks of 3 mmt total 17.2 mmt, or 3.73 mmt higher that the current stocks estimate. This is bullish for wheat and has contributed to today's rise in futures. Watch for further estimates to include lower revisions for both 2021 wheat production along with Canada's wheat export potential.
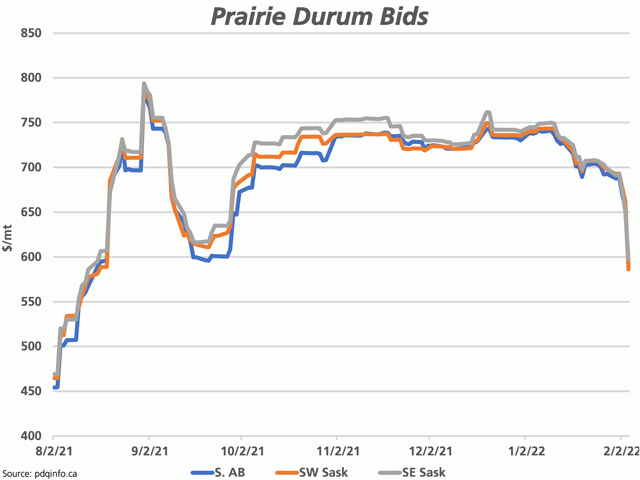
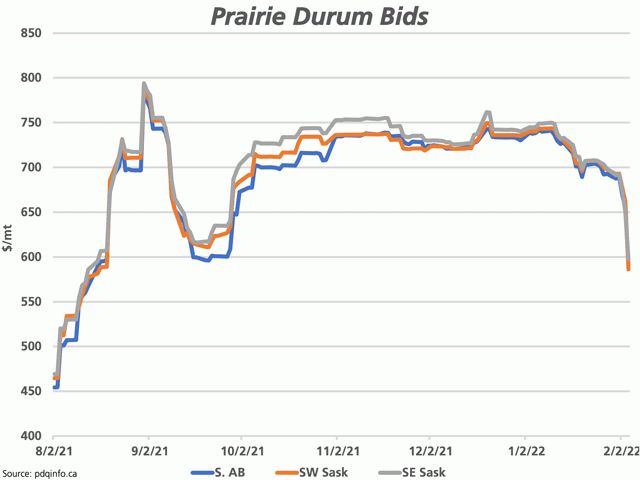
Durum stocks are reported at 2.094 mmt as of Dec. 31, down 56.4% from one year ago while 59.6% below the five-year average. This is equal to the pre-report estimates posted on social media, while the lowest stocks reported for this date since December 1988. Disappearance during the first five months accounts for 38.7% of estimated supplies, well-above the five-year average of 24.2%. Based on Agriculture and Agri-Food Canada's forecast, the outstanding forecast demand of 1.6 mmt plus forecast ending stocks of 450,000 metric tons are roughly equal to the current stocks estimate; the current estimate suggests that the durum market is on track to reach the current government estimates for 2021-22.
P[L1] D[0x0] M[300x250] OOP[F] ADUNIT[] T[]
Canola stocks are reported at 7.561 mmt, roughly as expected in pre-report estimates posted to social media. This is down 43% from one year ago and 47.5% below average, while the smallest estimated stocks in 14 years. This estimate implies total disappearance of 6.815 mmt during the first five months, down 3 mmt from the same period in 2020-21. Disappearance accounts for 47% of estimated supplies during the five months, which is well above the five-year average of 37.8%. Based on government forecasts, outstanding demand as of Dec. 31 plus forecast ending stocks equals 7.553 mmt, very close to the current estimate of stocks. The report was viewed as neutral for canola overall.
Barley stocks were reported at 3.146 mmt as of Dec. 31, down 43.6% from last year and 45.7% below the five-year average of 5.794 mmt. This is likely an all-time low on record for December stocks and to add context, January-through-August disappearance has averaged 4.6 mmt during the past five years. Current disappearance accounts for 59.3% of total estimated supplies which compares to the five-year average on this date of 45.5%. As we have been indicating in this space, barley exports during the first five months are 151,500 metric tons higher than the same period last crop year, requiring rationing of tight stocks during the balance of the crop year.
Canada's oat stocks were reported at 1.629 mmt, down 40% from one year ago and 38.3% below the five-year average of 2.638 mmt, while the tightest oat stocks since December 1991. Based on current estimates, implied disappearance of 1.643 mmt or 50% of estimated supplies during the first five months is higher than the five-year average of 41.4%, while at the same time, is on the pace of demand forecast by the government.
Dry pea stocks of 1.629 mmt are down 42.6% from one year ago and down 40% from the five-year average of 2.7 mmt. This is the lowest stocks reported for this date since December 2007, while disappearance during the first five months accounts for 42.4% of estimated supplies, close to the 41.6% five-year average. A combination of industry and prices have acted to effectively ration demand despite the much smaller crop.
Lentil stocks were reported at 1.182 mmt, down 36.2% from one year ago and 43.2% below the five-year average. This volume is the smallest volume seen since December 2009. Disappearance during the five months is reported at 856,800 mt, accounting for 42% of estimated supplies, well above the five-year average of 33% for this period. Today's estimate is close to the pace of demand forecast by AAFC in January.
Canada's corn stocks were estimated at 11.530 mmt, up 4.1% from last year and very close to the five-year average for this date. This is the highest Dec. 31 stocks reported for corn in three years, due to higher production in Ontario. During the past five years, the December-to-August disappearance has totaled 9.169 mmt, which would lead to estimated ending stocks or 2.361 mmt, slightly higher than the current 2.150 mmt estimate. Despite a record Ontario crop, farm stocks in the province are reported at 4.3 mmt, down from 4.950 mmt last year and the five-year average and the lowest seen since 2009, according to Statistics Canada data, which bears watching.
Soybean stocks were estimated at 3.285 mmt, down 9% from last year and 16.4% below the five-year average. This is the lowest Dec. 31 estimate in eight years, having fallen for four consecutive years. Disappearance over the first four months of the crop year accounts for 51% of total supplies, slightly ahead of the five-year average of 46.6% for this period. AAFC forecasts point to outstanding demand of 3.069 mmt in the January-through-August period, which suggests the pace of movement is on track to achieve the current forecast.
**
DTN 360 Poll
This week's DTN 360 poll asks your opinions about your approach to secure herbicide supplies for 2022. Please weigh in with your thoughts; you can find the poll on the lower-right side of your DTN Home Page.
Cliff Jamieson can be reached at cliff.jamieson@dtn.com
Follow him on Twitter @Cliff Jamieson
(c) Copyright 2022 DTN, LLC. All rights reserved.


Comments
To comment, please Log In or Join our Community .