Canada Markets
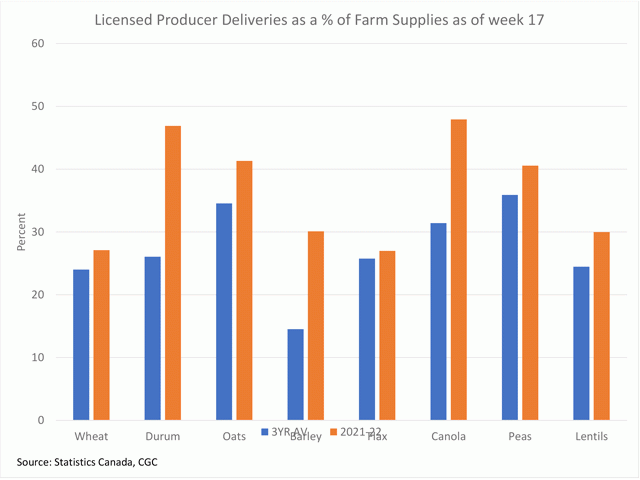
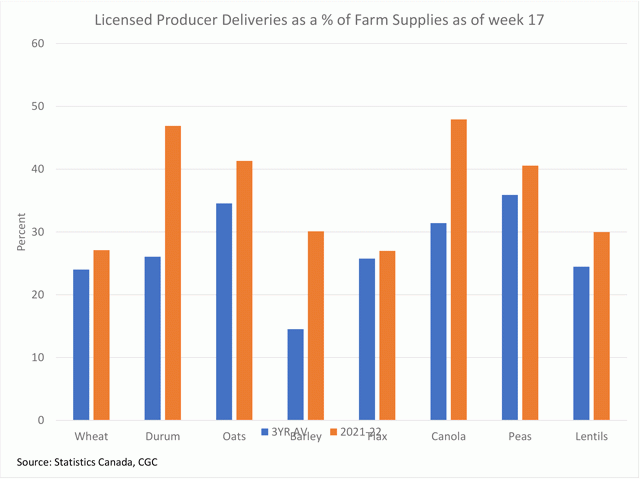
Licensed Producer Deliveries as a Percent of Farm Supplies
Statistics Canada data released Dec. 3 shows a net change in production across the principal field crops since the model-based estimates were released in September of slightly more than 900,000 metric tons. Across the principal field crops, the largest upward adjustment was seen for spring wheat at 688,000 mt while the largest downward revision was seen for durum at 891,100 mt since the September estimates based on the August model results.
Stocks of all grains, along with all estimates will be put to the test this crop year, with stocks of various crops to reach all-time lows. The question is how soon?
The attached chart shows producer deliveries for select grains as of week 17 as a percentage of available supplies. This is calculated with Canadian Grain Commission's week 17 cumulative producer deliveries as of a percentage of the sum of July 31 ending farm stocks and Statistics Canada's latest production estimates.
While all select grains shows this percentage higher than the three-year average, two crops that stand out are canola and durum.
P[L1] D[0x0] M[300x250] OOP[F] ADUNIT[] T[]
As of week 17, or the week ending Nov. 28, or the first one-third of the crop year, producers have delivered 6.5407 million metric tons (mmt) of canola into licensed facilities, down 16.7% from the same period in 2020-21 and 6.7% below the three-year average for this period. Following Statistics Canada's latest revision that saw a modest revision lower in production to 12.6 mmt, we see that 47.9% of available stocks have been delivered, which compares to the five-year average of 31% as of week 17. Available stocks are viewed as the sum of July 31, 2021, farm stocks of 1.053 mmt and Statistics Canada's latest production estimate of 12.595 mmt.
A similar situation exists for durum. Producers have delivered 1.2808 mmt of durum as of week 17, down 40% from the same period last crop year and 23.6% below the three-year average. This totals 46.9% of available farm supplies, calculated by adding 77,000 mt of farm stocks on July 31, 2021, to the latest production estimate of 2.6543 mmt. This compares to the three-year average for this period of 26.1% of available supplies delivered.
This study bears watching. Tightening stocks should play a role in supporting prices, while may also signal the markets' response to the current government estimates, which may signal the extent to which the estimates are accepted by the trade.
**
DTN 360 Poll
This week's poll, found on the lower-right side of your DTN Home Page, asks if you will consider pricing new-crop production? We value your opinion and thank you in advance for your response.
Cliff Jamieson can be reached at cliff.jamieson@dtn.com
Follow him on Twitter @Cliff Jamieson
(c) Copyright 2021 DTN, LLC. All rights reserved.


Comments
To comment, please Log In or Join our Community .