Canada Markets
Canada's Canola and the Global Trade
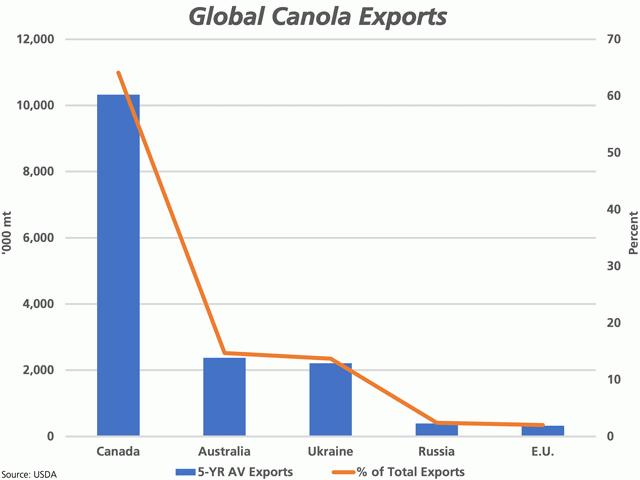
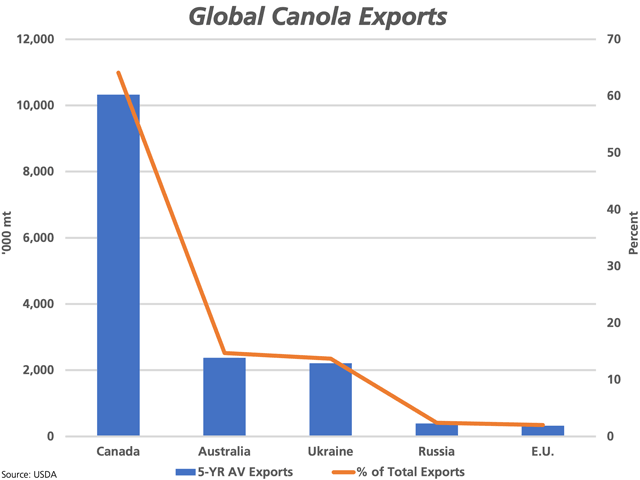
As the relentless heat on the Prairies takes a continued toll on crops, we look at Canada's normal position in the global canola trade. The attached chart shows the five-year average of Canada's canola exports at 10.323 million metric tons (mmt) (blue bars against the primary vertical axis, USDA data). This compares to the five-year average of 2.374 mmt for Australia; 2.210 mmt for Ukraine; 390,600 metric tons (mt) for Russia; and 324,400 mt for the European Union.
The brown line with markers represents this volume for each country as a percentage of the five-year average of global canola/rapeseed exports, as measured against the secondary vertical axis. For example, Canada's 10.323 mmt accounts for 64.1% of the five-year average of global exports of 16.099 mmt. This compares to Australia where the average exports account for 14.7% of the five-year average exports, 13.7% for Ukraine, 2.4% for Russia and 2% for the E.U.
A reduced Canadian canola crop is a big deal when one considers the global trade for the crop, although at the same time, prices cannot advance indefinitely as buyers switch to competing oils. This may help explain the divergence seen in the canola market on July 14, with November soybeans ending 31 1/2 cents higher, October soybean oil closing .34 cents higher, October soymeal ending $11.20/ton higher and November canola settling $23.30/mt lower.
P[L1] D[0x0] M[300x250] OOP[F] ADUNIT[] T[]
While global vegetable oil markets remain tight, this month's USDA reports included an upward revision in global production of the nine major vegetable oils (coconut, cottonseed, olive, palm, palm kernel, peanut, rapeseed, soybean, sunflowerseed) by 795,000 mt to a record 216.962 mmt. Revisions this month included an upward adjustment in the forecast production of palm oil, rapeseed oil, soybean oil and the largest revision over the month seen for sunflowerseed oil. Despite an upward adjustment in forecast domestic consumption, 2021-22 ending stocks were revised higher this month to 22.47 mmt, down .34% from the estimate for the current crop year.
Ending stocks of the nine major oilseeds for 2021-22 are calculated at 10.5% of global use, falling for a second year and is the smallest stocks/use ratio seen since the 1997-98 crop year.
Circling back to canola, USDA has forecast a year-over-year rise in global production of canola/rapeseed oil in 2021-22, while paring their forecast for Canada's production by 300,000 mt to 20.2 mmt. There may be several million metric tons lopped off of this production estimate in the months to come, which throws into question the entire vegetable oil balance sheet. This bears watching.
**
DTN 360 Poll
This week's poll question asks which crop you think has the greatest upside price potential over the upcoming crop year. Please feel free to weigh in with your thoughts, with this poll found on the lower-right side of your DTN Home Page.
Cliff Jamieson can be reached at cliff.jamieson@dtn.com
Follow him on Twitter @Cliff Jamieson
(c) Copyright 2021 DTN, LLC. All rights reserved.


Comments
To comment, please Log In or Join our Community .