Canada Markets
Statistics Canada's April Ag Trade Data
Canada's overall trade balance improved in April, with total monthly imports of all goods falling by 4.7% while exports fell by 1%. Canada's trade balance moved from a deficit of $1.3 billion in March to a $594 million surplus in April, with both import and export statistics largely affected by shutdowns by the vehicle manufacturers due to the ongoing shortage of semiconductor chips.
This marks the third trade surplus in the four months of 2021, while the smallest surplus of the three months.
Exports from the broad, farm, fishing and intermediate food products was reported at $4.037 billion in April, the lowest in three months although sales have remained relatively steady in the four months of 2021, while is up 15.8% from the same month in 2020.
Each month we look at various import and export data for the grains and grain products, with a focus on crops where weekly Canadian Grain Commission data fails to provide a complete picture of trade.
This month's report shows 179,073 metric tons of lentils exported, the largest monthly volume shipped in five months. While monthly statistics shows shipments to 55 countries in April, shipments to Turkey and India accounted for 49.5% of the total volume. The 46,765 mt shipped to India was the largest volume shipped since November 2020. Cumulative exports total 1.763 million metric tons, down 7% from the same period in 2019-20 and 2.5% higher than the five-year average. This volume represents 65% of the current 2.7 mmt forecast, which signals the expectation for heavy shipments during the last quarter of the year. In 2019-20, 965,000 mt were shipped in the final three months of the crop year.
Dry pea exports totaled 278,150 mt in April, up from the previous month and the lowest volume shipped in April in five years. China continues to dominate this movement, with 80.6% of this volume shipped in this direction. The remaining volume was split between 54 other countries. Cumulative exports are reported at 2.996 mmt, 3% higher than the same period last crop year and 14.6% higher than the five-year average. In May, Agriculture and Agri-Food Canada increased its forecast for annual exports by 100,000 mt to 3.9 mmt, while the current pace of movement represents 76.8% of this forecast, remaining on the steady pace needed to reach this target.
P[L1] D[0x0] M[300x250] OOP[F] ADUNIT[] T[]
Chickpea exports totaled 23,953 mt in April, which is the largest monthly volume shipped since November 2017. Pakistan continues as the single largest destination, while both Syria and Lebanon were shipped a volume that represented close to one-third of the month's shipments. Year-to-date, 105,482 mt has been shipped, 28.5% higher than last crop year and 5.1% higher than the five-year average. Cumulative exports account for 91.7% of the current AAFC target of 115,000 mt, well-ahead of the steady pace needed to reach this forecast.
Exports of mustard in April totaled 10,690 mt, down slightly from the previous month, but still the second-highest volume shipped this crop year and the largest April shipments seen in three years. A reported 46% of this volume was shipped to the U.S., while the second-largest buyer continues to be Belgium with 16.7% of the total shipped. During the first eight months of the crop year, 84,223 mt has been shipped, up 0.5% from the same period last crop year and down 4.7% from the five-year average. In May, AAFC increased its forecast for exports of mustard by 2,000 mt to 112,000 mt, while the current flow is on track to reach this forecast.
Statistics Canada reported the country's canary seed exports at 13,949 mt in April, up slightly from the previous month. Mexico and Columbia remain the top two destinations, with 35.8% of the volume shipped to these two countries. Cumulative exports total 119,739 mt, while is close to equal to the same period in 2019-20 while 6.2% higher than the five-year average. The May AAFC forecast included a 5,000 mt increase in canary seed exports to 160,000 mt, consistent with the previous crop year, while exports remain on the steady pace needed to reach this forecast.
Barley exports were reported at 522,848 mt in April, by far the largest monthly volume shipped this crop year and the largest monthly volume shipped in many crop years. China remains the top buyer, with 97% of the volume shipped to this country. Cumulative exports total 2.976 mmt, 88% higher than the same period last crop year and 104% higher than the five-year average. In May, AAFC increased its export forecast from 3.750 mmt to 4.2 mmt, which includes the export of barley products such as malt. This would indicate record exports if achieved.
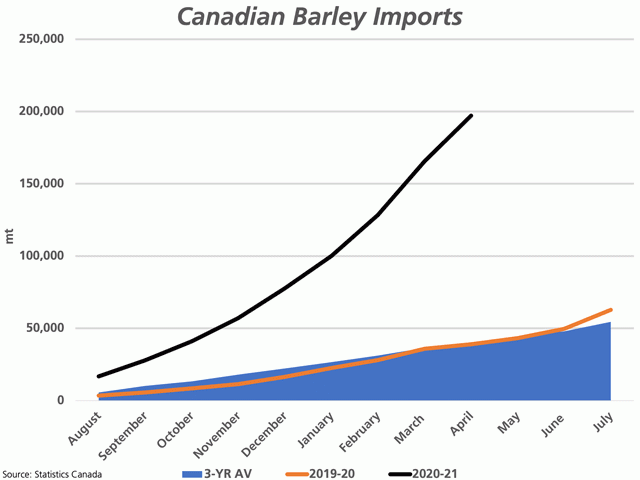
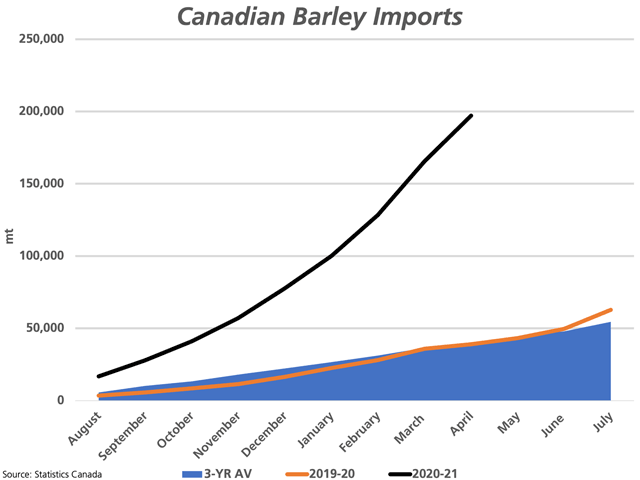
At the same time, imports of barley have increased this crop year, as seen on the attached chart, to help ease tight supplies in the feed market. A reported 31,501 mt was imported in April, down slightly from the previous month, but still close to the largest volume imported since April 2015. Year-to-date imports total 197,070 mt, while AAFC increased its forecast in May from 180,000 mt to 270,000 mt, which could be exceeded, based on available supplies for import.
Corn exports in April totaled 228,254 mt, the largest monthly volume shipped since May 2018. Most of this volume was shipped to Europe, with Spain, Ireland and the U.K. shipped 91% of the total volume. Cumulative exports for the crop year total 834,249 mt, up 144% from the same period last crop year and 5.9% higher than the five-year average. In May, AAFC revised lower its forecast for corn exports by 200,000 mt to 1.2 mmt, while the current pace of movement is slightly ahead of the steady pace needed to reach this forecast.
Soybean exports were reported at 111,055 mt in April, the lowest volume shipped in 24 months. The largest volumes were shipped to Japan, Indonesia and China, which accounted for 63.4% of the total volume. Missing in this month's data was Iran, which has been a top destination, if not the top destination, for 11 consecutive months. Total exports are seen at 3.885 mmt, up 42% from the same period last crop year and 6.2% higher than the five-year average. In May, AAFC increased its forecast for Canadian soybean exports by 200,000 mt to 4.6 mmt, while the current pace of movement is well-ahead of the steady pace needed to reach this forecast.
Canola oil exports were reported at 318,802 mt in April, down from the previous month, but still the second-highest volume shipped this crop year. Cumulative exports total 2.565 mmt, up 1.5% from last year and 6.7% higher than the three-year average.
Canola meal exports total 452,457 mt, down from the previous month and slightly below the four-month moving average. Exports of meal total 4.018 mmt, up 9.8% from the same period last crop year and 14.8% higher than the three-year average.
Ethanol imports in April totaled 99 million litres, the second largest volume imported this calendar year. January-through-April imports total 328 million litres, down 6.6% from last year and 7.7% below the three-year average.
Cliff Jamieson can be reached at cliff.jamieson@dtn.com
Follow him on Twitter @Cliff Jamieson
(c) Copyright 2021 DTN, LLC. All rights reserved.


Comments
To comment, please Log In or Join our Community .