Canada Markets
Statistics Canada's March Trade Data
Statistics Canada reports a widespread increase in imports of all goods in March, with imports up 5.5% to their highest level reported since May 2019 at $51.8 billion, while exports of all goods increased by a modest 0.3% to $50.6 billion. As a result, Canada's trade balance with the world moved from the trade surplus seen during the past two months to a trade deficit of $1.1402 billion. Despite the move, this is the smallest trade deficit seen since December 2019.
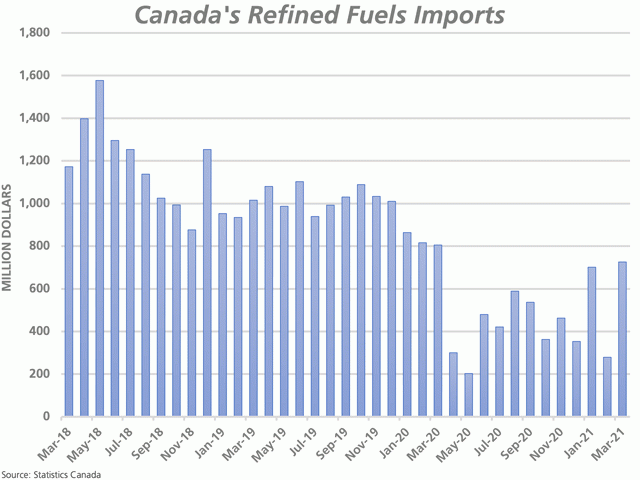
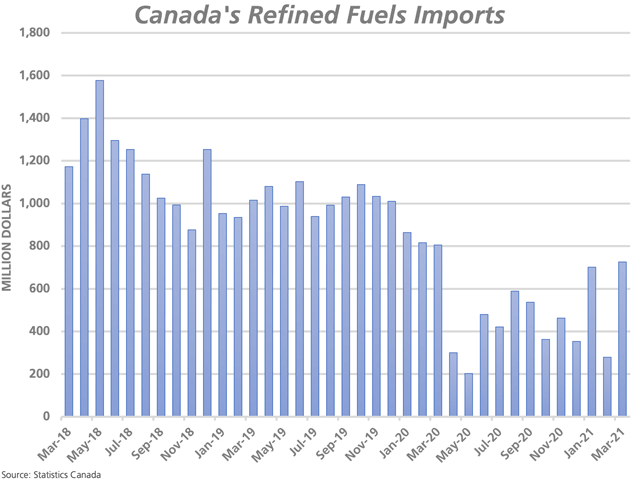
It is interesting to note that the largest surge in imports was seen in energy products of 54.7%, largely due to the import of refined products, while today's Calgary Herald notes that the CEO of Imperial Oil has stated that Canadian gasoline demand remains at 80% of normal levels.
Statistics Canada's broad farm, fishing and intermediate food products category shows exports falling by a modest 0.04% from February's record of $4.1523 billion in March.
Here is a look at various trade data as it relates to grains and grain products.
Lentil exports in March increased to 170,559 metric tons, the largest volume shipped in four months. A reported 31% of this volume was shipped to the United Emirates, while 27% was shipped to Turkey, a significant increase for both countries when compared to recent months. Year-to-date exports total 1.584 million metric tons, up 3.1% from last year and 2% higher than the five-year average for this period. At the same time, only 58.7% of the current 2.7 mmt Agriculture and Agri-Food Canada export forecast has been reached in the first two-thirds of the crop year. This is behind the pace needed to reach this forecast, although movement in the April through July period of 2020 averaged 331,000 mt, the largest volumes shipped over the course of the crop year.
Dry pea exports totaled 274,253 mt in March, the lowest volume shipped in four months but still the largest March shipments seen in four years. China remains the largest destination at 73% of the total volume shipped, although the volume shipped to China was the smallest seen in three months. Cumulative shipments total 2.718 mmt, 10.5% higher than the same period in 2019-20 and 20.2% higher than the five-year average. This volume represents 71.5% of the current 3.8 mmt AAFC export forecast, ahead of the pace needed to reach this forecast.
P[L1] D[0x0] M[300x250] OOP[F] ADUNIT[] T[]
Chickpea exports totaled 16,830 mt in March, the largest monthly volume shipped so far this crop year. A reported 49% of this volume was shipped to Pakistan, while a further 23.8% of this volume was shipped to the United States, close to the volumes shipped in the previous month. Cumulative shipments of 81,528 mt are up 13.9% from last year and down 8% from the five-year average. Cumulative exports account for 70.9% of the current AAFC forecast, slightly ahead of the pace needed to reach this target.
Mustard shipments in March totaled 10,971 mt, the largest monthly volume shipped this crop year. Cumulative exports total 73,534 mt, exactly where we were at for this period in 2019-20 and 5.3% lower than the five-year average. Movement is slightly ahead of the current pace needed to reach the current 110,000 mt forecast by AAFC that is expected to drive stocks to extremely tight levels as of July 31.
Canary seed exports were reported at 13,659 mt in March, down from the previous month but still the second largest monthly volume shipped this crop year and the largest March volume shipped in four years. Mexico remains the primary destination with 27% of the volume shipped, while a further 8% was shipped to Columbia. Cumulative volumes total 105,791 mt, down 1.5% from this period last crop year and 7.2% higher than the five-year average. Movement remains on track to reach the current 155,000 mt AAFC forecast, a forecast that was revised by 5,000 mt higher in April while ending stocks are forecast to be extremely tight.
Exports of oats were reported at 107,837 mt in March, the smallest monthly volume shipped so far this crop year. Movement to the U.S. this month was the smallest volume seen since July 2020. So far this crop year, 1.516 mmt has been shipped, 18.3% higher than this time last year while 5.6% higher than the five-year average for this eight-month period. Only 43.5% of the current AAFC export forecast of 2.95 mmt has been achieved, which also includes an allowance for oat products. Movement is behind the pace needed to reach this forecast.
Canada exported 344,744 mt of barley in the month of March, with 96.8% of this volume destined for China, the largest volume shipped since November. The cumulative volume shipped is 2.453 mmt this crop year, up 94.8% from last crop year and 129% higher than the five-year average. AAFC revised higher their forecast for crop year exports (including barley products) by 50,000 mt this month to 3.750 mmt in April, while the current pace of exports is on track to reach this forecast.
It is also interesting to note Canada's barley imports totaling 37,170 mt in March, the largest monthly volume reported since April 2015. Cumulative imports total 165,569 mt, up from 35,860 mt imported during the same period in 2019-20, while AAFC curiously increased its import forecast from 60,000 mt to 180,000 mt in April, a volume that will quickly be exceeded with four months remaining in the crop year. Of this volume, 83.7% was imported into Alberta.
Exports of flax totaled 63,100 mt in March, the largest volume shipped in three months and the largest March shipments seen in five years. A reported 59% of this volume was shipped to China, the largest volume shipped to this country since December. Cumulative shipments are up 125.2% from last year and 23.4% higher than the five-year average, while the pace of movement is slightly ahead of the pace needed to reach the current 540,000 mt AAFC forecast.
Soybean exports totaled 263,115 mt, up from the previous month and could be the largest March shipments ever. A reported 35% of this volume was shipped to Iran, while Indonesia replaced China as the second-largest destination for Canadian soybean exports this month. Cumulative exports total 3.774 mmt, up 46% from this time last year while 7.2% higher than the five-year average. Cumulative exports have reached 86% of the current 4.4 mmt AAFC forecast for 2020-21, with five-months remaining in the row-crop crop year.
Canada exported 57,911 mt of corn during March, with 55.6% of this volume shipped to Ireland and 44% shipped to the U.S. Total exports for 2020-21 are shown at 606,001 mt, up 257% from this time last year and 11.8% higher than the five-year average. The current pace of exports is behind the pace needed to reach the current AAFC forecast of 1.4 mmt, although exports tend to be weighted to the latter months of the crop year.
A surge in the export of both crude and refined canola oil saw what appears to be a monthly record for exports in March at 348,240 mt, up 38.4% from the previous month. Exports during first eight months of the crop year total 2.246 mmt, down 1% from the same period last crop year while 6% higher than the three-year average.
Canada's canola meal exports are up 39.3% in March from the previous month, partially due to demand faced but also partially a recovery from the bitterly cold prairie weather faced on the Prairies that slowed activity. Canada exported what also appears to be a record 564,854 mt of soymeal in March. Cumulative exports of 3.557 mmt are up 11.3% from 2019-20 and 16.2% higher than the three-year average.
Canada's energy imports in March included 101.9 million liters of ethanol imported, the largest monthly volume imported in four months. During the first three months of 2021, 229 million liters have been imported, down 24.4% from the same period last year and down 13.5% from the three-year average.
Cliff Jamieson can be reached at cliff.jamieson@dtn.com
Follow him on Twitter @Cliff Jamieson
(c) Copyright 2021 DTN, LLC. All rights reserved.


Comments
To comment, please Log In or Join our Community .