Canada Markets
USDA Global Veg Oil Statistics
March 11 trade saw a number of contract highs reached in global oilseeds and vegetable oils, including November canola, May soybean oil and May Malaysian palm oil. Vegetable oil demand remains the story driving oilseed prices higher, while soymeal remains in a downtrend as concerns grow over China's feed demand in light of recent African swine fever outbreaks.
A look at this week's USDA WASDE estimates for global vegetable oils begs the question, "what could possibly go wrong?"
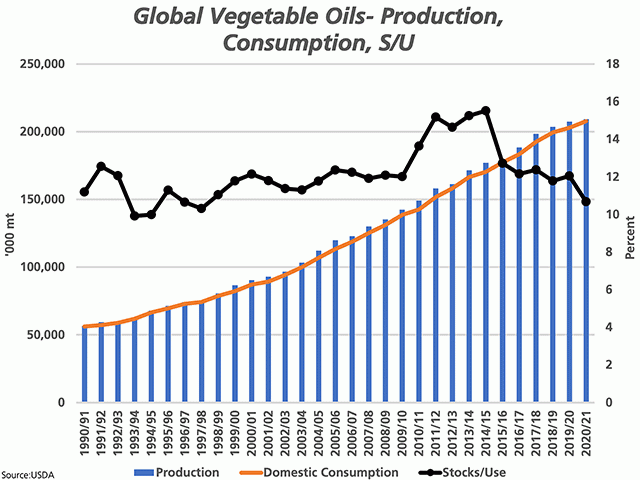
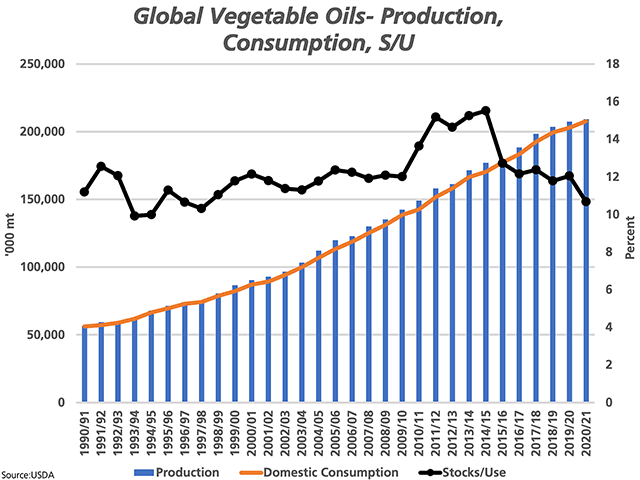
The data included on the attached chart is for the nine major vegetable oils as reported by the USDA, which includes oils produced from coconut, cottonseed, olive, palm, palm kernel, peanut, rapeseed, soybean and sunflower crops.
March data reports 2020-21 global production at 209.379 million metric tons (blue bars) which compares to the global domestic use of 207.793 mmt, both plotted against the primary vertical axis. From Excel calculations for the Compound Annual Growth Rate (CAGR), we see that production has achieved a 3.5% CAGR over the past 10 years, which compares to 3.8% for domestic use or demand. This spread narrows over the 20-year time frame, with a 4.3% CAGR for production and 4.4% for demand.
P[L1] D[0x0] M[300x250] OOP[F] ADUNIT[] T[]
Over the chosen time period starting at the 1990-91 crop year, vegetable oil production is shown to face only one year-over-year drop, with a modest drop seen in the 2015-16 crop year. Global use has increased every year during this period.
While not shown, the calculation of production less demand results in an excess of 1.586 mmt in the 2020-21 crop year, which is the lowest volume calculated in five years, and compares to the three-year average of 4.852 mmt.
While not shown, global stocks are to fall by 9.3% in 2020-21, to 22.176 mmt, the lowest seen since 2010-11 and below the five-year average of 23.3 mmt.
The black line with markers represents the global stocks/use ratio of the vegetable oil produced from these nine oilseeds, calculated against the secondary vertical axis, which is forecast to fall from 12.1% in 2019-20 to 10.67% in 2020-21. This is the tightest stocks/use ratio calculated since 1998-99.
Looking at individual oilseeds, the overall balance will be largely affected by the large oilseeds such as palm oil and soybeans. The stocks/use ratio for palm oil is calculated at 15.3% in 2020-21, the lowest in five years while slightly lower than the five-year average. This ratio is calculated at 7.7% for soybean oil, which is equal to the five-year average.
The stocks ratio for canola/rapeseed oil is calculated at 9.5% for 2020-21 based on the March WASDE data, which is slightly higher than the 9.3% calculated the previous year, which was the tightest stocks/use ratio calculated since 2009-10. The 9.5% calculated for 2020-21 is 3.3 points lower than the five-year average of 12.9%.
Cliff Jamieson can be reached at cliff.jamieson@dtn.com
Follow him on Twitter @Cliff Jamieson
(c) Copyright 2021 DTN, LLC. All rights reserved.


Comments
To comment, please Log In or Join our Community .