Canada Markets
Prospective 2021-22 Wheat Stocks, with Varying Yields Over Seeded Acres
Based on the assumptions made by Agriculture and Agri-Food Canada's February report, the wheat balance sheet (excluding durum) is to remain fairly steady in 2021-22 with wheat stocks to rise for a third straight year, but by a modest 100,000 metric tons to 5 million metric tons.
This is based on early unofficial AAFC estimates that point to forecast 2020-21 ending stocks of 4.9 mmt, while seeded acres in 2021 are to fall by 5% from 2020 and yield is to average 53.5 bushels per acre (bu). Their forecast also includes an estimated 98% of acres harvested, while has pegged total demand at 26.446 mmt, down 7.5% from 2020-21 given a cautious approach on exports to China.
P[L1] D[0x0] M[300x250] OOP[F] ADUNIT[] T[]
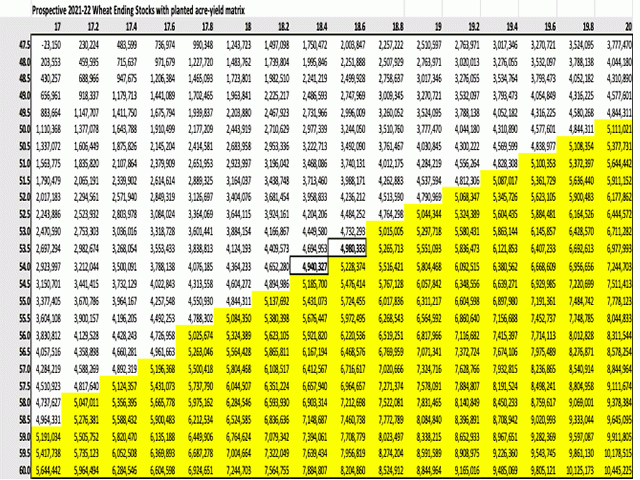
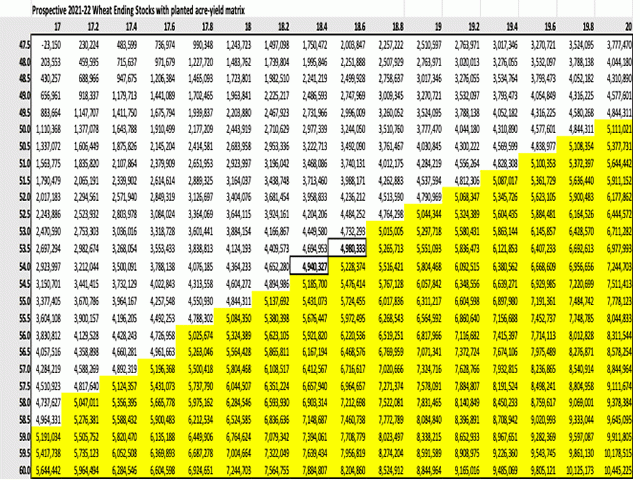
The attached chart shows combinations of yield and seeded acres and their effect on 2021-22 ending stocks, given the assumptions mentioned. The highlighted boxes in the middle of the chart approximately represent the current AAFC forecast for 2021-22 with ending stocks to increase to 5 mmt, while the yellow-shaded area represents combinations of yield and acres that would lead to a year-over-year increase in ending stocks.
For perspective, during the last five years (2016-20), the average annual yield has ranged from 53 to 55.1 bpa in 2020. During the past 10 years (2011-20), this yield has ranged from 44.1 to 55.1 bpa, with the lower-end of the range below the lowest yield included on the chart of 47.5 bpa.
As well, during the past five years, seeded acres of wheat (excluding durum) has ranged from 17.3 million acres to 20.1 million, a range that spans across the entire horizontal axis on the chart. During the past 10 years this range has spanned even wider, from 17.3 million to 21.3 million acres, which is higher than the upper-limit of the chart's data.
The significant white area on the chart would indicate that there are a number of combinations that could lead to a reduction in stocks in 2021-22, when leaving demand fixed at 26.4 mmt, which includes a 2 mmt reduction in exports to 19 mmt. Any hint that China could be buying new crop wheat, while at a time when Russia could be applying its variable-rate export tax to 2021-22 exports, could prove supportive for prices.
Cliff Jamieson can be reached at cliff.jamieson@dtn.com
Follow him on Twitter @Cliff Jamieson
(c) Copyright 2021 DTN, LLC. All rights reserved.


Comments
To comment, please Log In or Join our Community .