Canada Markets
Primary Elevator Stocks and Shipments as of Week 23
Stocks of all grain reported by the Canadian Grain Commission were reported at 4.0528 million metric tons as of week 23, or the week ending Jan. 10. This is up from the previous week due to a surge in producer deliveries from 844,100 metric tons in week 22 to 1.6411 mmt in week 23.
When the current volumes in primary storage are compared to the estimated primary working capacity, as reported by Quorum Corporation in its weekly Grain Monitoring Program report, Manitoba stocks represent 73.1% of estimated working capacity, Saskatchewan stocks represent 77.1%, Alberta stocks total 81.2% of this estimate and British Columbia stocks total 97.5% of the estimated working capacity. Overall stocks represent 77.6% of working capacity, with space overall viewed as favorable.
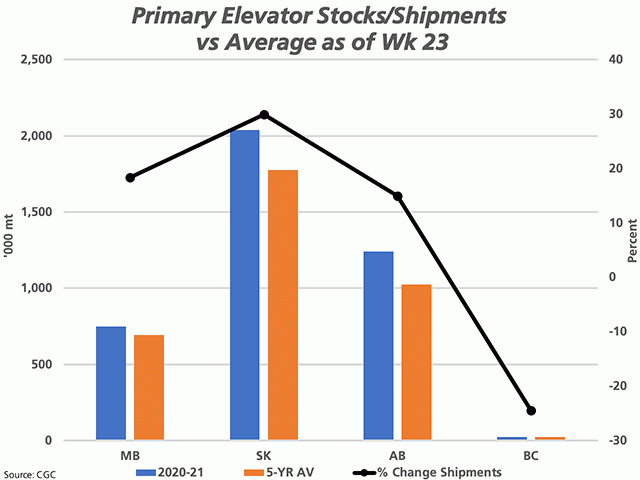
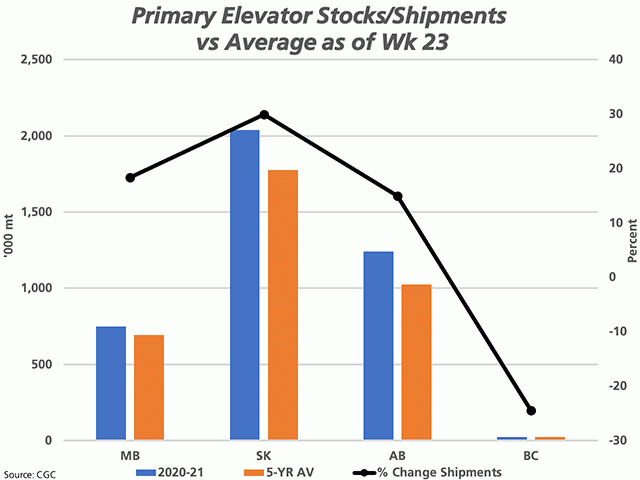
Across the provinces, current Manitoba inventories are 7.9% higher than the five-year average, Saskatchewan stocks are 14.7% higher, Alberta stocks are up 21.1% higher while B.C. stocks are 4.1% lower. Overall stocks are calculated at a volume that is 15.1% higher than the five-year average.
P[L1] D[0x0] M[300x250] OOP[F] ADUNIT[] T[]
A combination of demand for grains along with higher prices, cooperative weather and expansion in primary space over time has contributed to this increase in stocks. Canadian Grain Commission data as of Aug. 1 each year shows primary elevator space increasing from 5.583 mmt across 335 elevators, as of Aug. 1 2015, to 8.012 mmt across 360 elevators as of Aug. 1 2020. This is an increase of 1.429 mmt, or 21.7%, over five years, or 285,800 mt annually.
As of week 23, cumulative shipments of all grain from primary elevators totals 23.336 mmt, which is 9.3% higher than the five-year average. Across the three prairie provinces, this ranges from 14.9% higher in Alberta to 18.3% higher in Manitoba to 29.9% higher in Saskatchewan. Shipments from the four elevators listed for British Columbia, as of Aug. 1 2020, are 24.5% below average. The black line with markers represents this percent change across the four provinces.
**
DTN 360 Poll
This week's poll question asks if you have used the move higher in grain futures to price new-crop deliveries? You can weigh in with your thoughts on this poll located on your DTN Canada Home Page. We thank you for your input.
Cliff Jamieson can be reached at cliff.jamieson@dtn.com
Follow him on Twitter @CliffJamieson
(c) Copyright 2021 DTN, LLC. All rights reserved.


Comments
To comment, please Log In or Join our Community .