Canada Markets
USDA's Global Wheat Data Observations
The USDA's January World Agricultural Supply and Demand Estimates report could be viewed as somewhat supportive for wheat markets, with ending stocks for both the U.S. and global markets below pre-report estimates. While the global ending stocks estimate was reduced by 3.31 million metric tons this month to 313 mmt, it still represents a record carryout and is 13% higher than the five-year average.
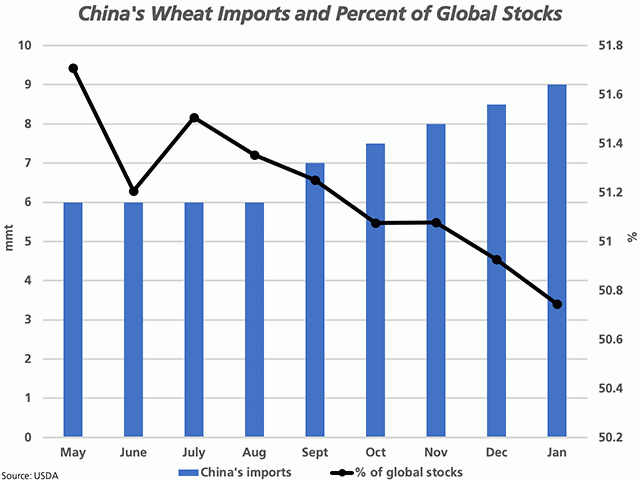
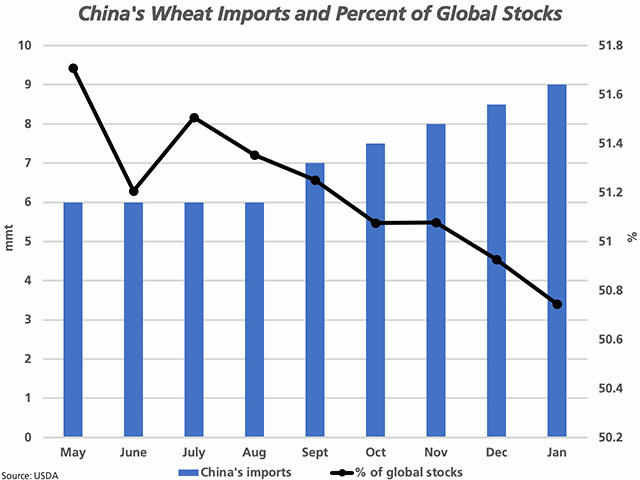
One interesting observation is the continued upward revisions made for China's imports of wheat. As seen on the attached chart, starting with the USDA's first 2020-21 estimates in May 2020, China's import estimate was increased from 6 to 7 mmt in September, while has increased 500,000 mt per month ever since. With the estimate now at 9 mmt, this would be the largest volume imported since 1995-96, when 12.5 mmt was imported, while is more than double the five-year average of 4.069 mmt.
The 9 mmt import estimate compares to the current forecast for Indonesia at 10.8 mmt, while Egypt is forecast to import 13 mmt, the world's largest importer.
P[L1] D[0x0] M[300x250] OOP[F] ADUNIT[] T[]
It is also interesting to note the trend in China's estimated carryout as a percentage of global supplies. While the trend is lower, falling in each of the past three months, the forecasts continue to suggest that China will be holding 50.7% of all global wheat stocks at the end of 2020-21, up from 50.5% in 2019-20 and 49.4% in 2018-19.
Looking at data for global stocks in the hands of the eight major exporters, this month's data shows this volume to total 59.928 mmt, the lowest in seven years. As a percentage of global stocks, this represents 19.1%, the lowest percentage calculated in the past 20 years checked and well-below the 48% calculated in 2005-06.
On the export side, upward revisions of 500,000 metric tons were made for exports from Canada, the European Union and India in January's report, while Argentina's export potential was pared by 500,000 mt and Russia's potential was pared by 1 mmt. It is interesting to note that while Russia is forecast to export 39 mmt, the U.S. is second at 26.81 mmt and Canada and the EU are both forecast to move 26.5 mmt. The second spot is up for grabs.
The USDA continues to hold an optimistic view of Canada's potential, with AAFC forecasting all-wheat exports at 24.970 mmt as compared to the USDA's 26.5 mmt.
Cliff Jamieson can be reached at cliff.jamieson@dtn.com
Follow him on Twitter @CliffJamieson
(c) Copyright 2021 DTN, LLC. All rights reserved.


Comments
To comment, please Log In or Join our Community .