Canada Markets
Canada's Durum Exports Continue Strong
Due to slight timing differences, Statistics Canada reported Canada's November durum exports at 799,206 metric tons for November, while the Canadian Grain Commission's Export of Canadian Grain and Wheat Flour shows a volume of 791,800 mt.
While durum exports exceeded 700,000 mt in April 2019, this is the largest monthly export shown in Statistics Canada data going back to December 2011 and may be the largest monthly volume shipped ever.
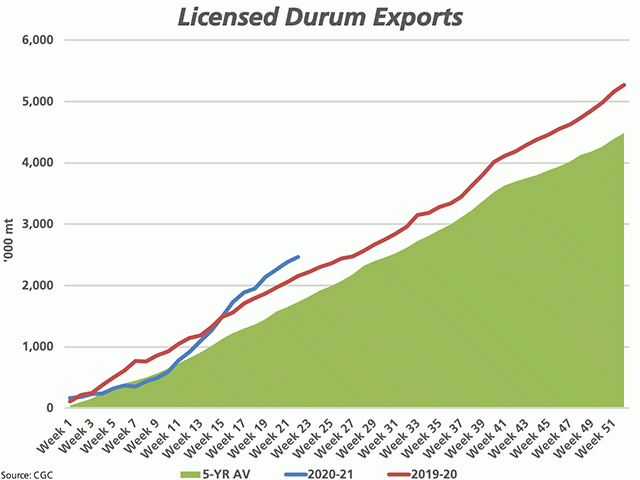
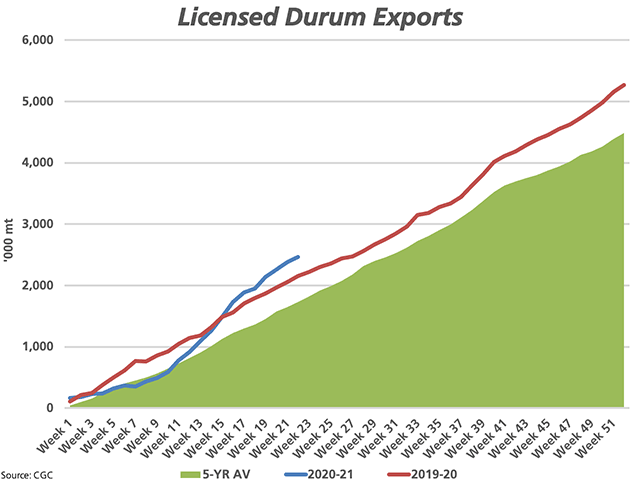
As seen on the attached chart, licensed exports through week 22, or the week ending Jan. 3, totals 2.466 million metric tons (blue line), up 14.6% from the same period in 2019-20 (red line) and 42.7% higher than the five-year average (green shaded area).
Canadian Grain Commission data shows that of 31 destinations reported for durum in November, shipments to eight countries increased year-over-year, including a 410,400 mt or 123% increase in the volume shipped to Italy. Shipments to 13 destinations fell year-over-year, which includes a year-over-year drop of 541,800 mt in movement to Turkey. It is interesting to note that there are 2020-21 shipments reported to nine countries where there were no shipments in year-to-date data for 2019-20, totaling 189,900 mt.
P[L1] D[0x0] M[300x250] OOP[F] ADUNIT[] T[]
As of November, 745,900 mt has been shipped to Italy, up 122.9% from the same period in 2019/20 and up 157% from the five-year average, likely the fastest pace of movement to this market ever.
During the past five years, cumulative licensed exports as of week 22 have averaged 37% of total crop year exports to all destinations, a pace that projects forward to crop year exports of over 6 mmt, or a level that would lead to significantly tighter stocks. Due to the pace of movement, Statistics Canada's Dec. 31 estimate of stocks will be of particular interest for this market, due for release on Feb. 5.
The current pace of exports are roughly 215,200 mt ahead of the steady pace needed to reach the current 5.320 mmt export demand forecast from Agriculture and Agri-Food Canada.
As of Jan. 8, pdqinfo price data for the six regions of the Prairies shows prices ranging from $299.43/mt to $308.67/mt, averaging $302.82/mt.
Looking at pdqinfo's price data during the past five years for the southern Alberta region, there has been a downward trend in the No. 1 durum price over the course of the crop year in 2015-16, 2016-17 and 2017-18. The last two crop years, 2018-19 and 2019-20, prices followed a higher trend over the course of the crop year. In 2018-19, price advanced $13.32/mt from Jan. 1, 2019 to a high on March 7. In 2019-20, price rallied by $27.81/mt from Jan. 1 to a high on July 17.
**
DTN 360 Poll
This week's poll asks how you view soybeans as a cropping choice for 2021. You can weigh in with your thoughts on this poll, which is found on the lower-right side of the DTN Home Page. We thank you for sharing your opinions.
Cliff Jamieson can be reached at cliff.jamieson@dtn.com
Follow him on Twitter @CliffJamieson
(c) Copyright 2021 DTN, LLC. All rights reserved.


Comments
To comment, please Log In or Join our Community .