
Canada Markets
European Milling Wheat Testing Contract Highs
Despite what may be viewed as bearish global data for wheat markets being released by the USDA, global uncertainty reigns with the recent news of an export tax to be initiated by Russia's government, as of Feb. 15, providing support for markets. On Dec. 28, Russian analyst SovEcon reduced its forecast for Russia's 2020-21 exports from 40.8 million metric tons to 36.3 mmt due to the export tax, which compares to the 40 mmt forecast by the USDA.
On Dec. 28, Reuters reports that Egypt, the world's largest wheat buyer, expects prices to stabilize. "We've seen highs during the last three months which, in my opinion, are not caused by what we used to say before, such as weak harvests or climate factors, it's all coming from uncertainty," stated the country's Supply Minister Ali Moselhy.
P[L1] D[0x0] M[300x250] OOP[F] ADUNIT[] T[]
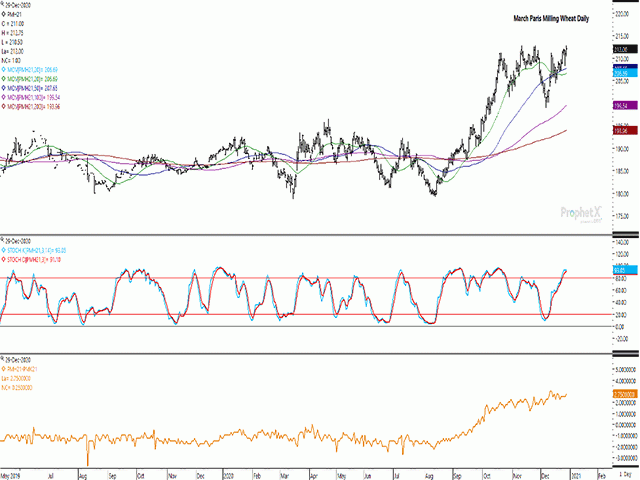
While all three U.S. markets traded sideways on Tuesday, March European milling wheat reached its contract high of EUR 212.75/metric ton for a third time, having reached this level on Nov. 11, Nov. 25 and again on Dec. 29.
Today's move was despite Euro strength against the U.S. dollar, while this week's Algerian tender for Feb. delivery may be viewed as being awarded to French suppliers and supportive for the market.
As seen in the lower study of the attached chart, the March/May spread closed at a EUR 2.75 inverse (March trading over the May), a signal of front-end demand. Looking back at this date over the past five years, this spread traded at even money in 2019 and at a carry for each of the four years prior, averaging a EUR 2.50 carry.
While not shown, the continuous active chart shows nearby resistance at EUR 213.25/mt, which represents the 50% retracement of the move from the 2012 high to the 2016 low. The October high on this chart reached EUR 214. A breach of these levels could result in a further move to the 61.8% retracement at EUR 228.41/mt, which if achieved, would be the highest trade seen since May 2013.
Cliff Jamieson can be reached at cliff.jamieson@dtn.com
Follow him on Twitter @CliffJamieson
(c) Copyright 2020 DTN, LLC. All rights reserved.

Comments
To comment, please Log In or Join our Community .