Canada Markets
The New-Crop Oilseed Pricing Dilemma
A prairie canola producer in touch with DTN this week pointed to concerns that he had priced too much canola too early this year, which was easy to do given the attractive prices shown early and the widespread unawareness of the massive demand that was about to hit the market for global oilseeds and vegetable oils. His focus has shifted ahead to 2021-22 and how best to position for the year ahead.
The demand in the oilseeds is clearly on the front-end, with all canola futures contracts seen inverted (each contract trades higher than the one following), while soybean contracts were inverted, returned to a carry, while are now on the verge of moving back to a bullish inverse on the March/May spread as trade rolls to the March contract.
In the canola market, the last time ending stocks of canola fell below 1 mmt was in the 2012-13 crop year. On Dec. 17, 2012, the old-crop-new-crop July 2013/Nov 2013 futures inverse was $48/mt, which compares to today's $61.30/mt, while the inverse in 2012-13 continued to strengthen to a high of $94.70/mt in May 2013.
Focus on the front-end or old-crop trade could remain a feature for months to come, while new-crop futures could require a period of time before coming to life. At the same time, the prospect of tightening ending stocks, which signals tightening beginning stocks and lower supplies for the 2021-22 crop year, will eventually become a driving force in new crop trade.
P[L1] D[0x0] M[300x250] OOP[F] ADUNIT[] T[]
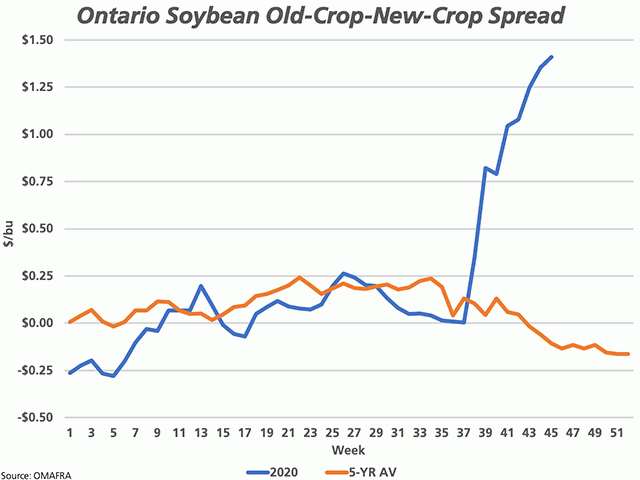
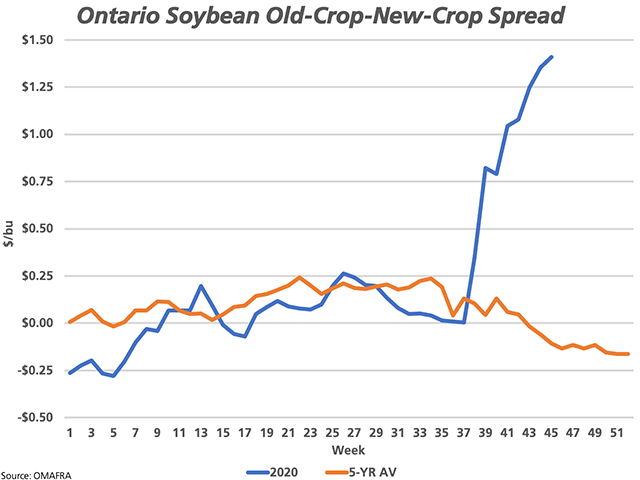
Cash price data from Ontario's Ag Ministry shows the similar trend in the spread calculated from subtracting new-crop soybean cash prices from old-crop. The blue line represents the 2020 spread, with data updated monthly and available to week 45 or early November. While the spread tracked closely to the five-year average (brown line) through the first 36 weeks of the calendar year, the rapid rise of old-crop futures and cash prices resulted in a sharp and sudden divergence from the average.
As of week 45 of the calendar year, the average spread was $1.41/bushel, while this spread has continued to widen, with many of these spreads approaching $2/bu on Dec. 16 according to cash data reported by DTN.
While patience in new crop pricing may be prudent, these spreads bear watching.
**
DTN 360 Poll
This week's poll asks if you think your area will benefit from increased biofuel production that is expected to take place as a result of Canada's Clean Fuel Standard that is soon to be released.
This poll can be found on the lower-right side of your DTN Canada Home Page. We thank you for your input!
Cliff Jamieson can be reached at cliff.jamieson@dtn.com
Follow him on Twitter @CliffJamieson
(c) Copyright 2020 DTN, LLC. All rights reserved.


Comments
To comment, please Log In or Join our Community .