Canada Markets
Barley Exports Robust, Domestic Prices Pushed Higher
Reuters reported on Nov. 2 that Australia has appealed China's 80.5% tariff on Australian barley imports and has lost. The report indicates that Australia would typically ship 70% of its exports into its markets.
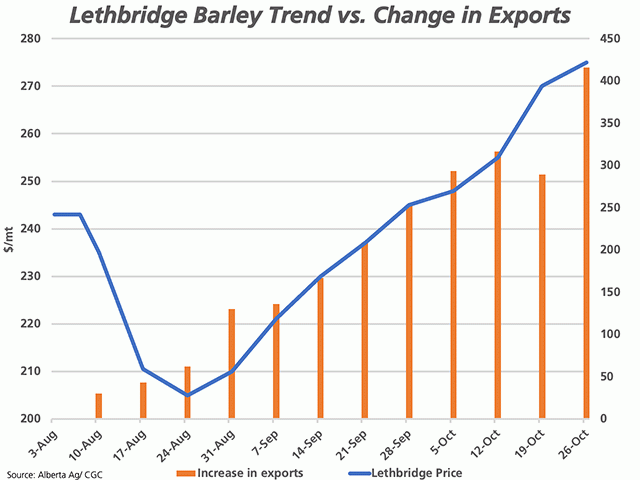
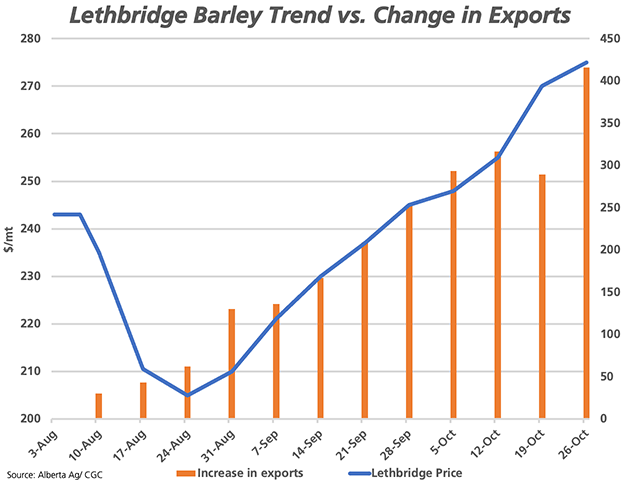
At the same time, Canada's exports continue to surge. As of week 12, the Canadian Grain Commission has reported 749,700 metric tons exported through licensed channels, up 124.7% from the same period last crop year and 202.5% higher than the five-year average. The year-over-year change in exports is shown by the brown bars on the attached chart, with the year-over-year change now at 416,000 mt, as of week 12 CGC statistics.
It is early for such aggressive shipments. When the seasonality of barley shipping is considered, we see that during the past five years, an average of 8.9% of the crop year's total exports (including products) has been achieved, as of week 12 CGC data, which represents the first 23% of the crop year. When only the last three years are considered, a higher average of 11.4% of total crop year exports has been shipped through licensed facilities in the first 12 weeks.
Using either of these calculations, we can project forward to crop year exports that would easily surpass available supplies. It is important to note that Agriculture and Agri-Food Canada's latest estimates indicate that crop year exports of barley will fall slightly in 2020-21 to 3 million metric tons, down 1.8% or 54,000 mt from the previous crop year. At the same time, ending stocks of barley are forecast to grow by 143,000 mt, or 14.9%, year-over-year to 1.1 mmt, which would be the highest seen in three years.
P[L1] D[0x0] M[300x250] OOP[F] ADUNIT[] T[]
The blue line shows the trend in the cash price for feed barley in southern Alberta since the beginning of the crop year. This is represented by the upper-end of the weekly range reported by Alberta Agriculture, with the latest report showing $275/mt as the high for the week-ending Oct. 26. This is a sharp and sudden adjustment since prices dipped close to $200/mt in late August.
In addition to the export side of the equation, a perfect storm of events is supporting the price move higher. Higher corn futures, a weaker Canadian dollar making that corn costlier, backed up cattle in feedlots and reports of increasing carcass weights are pointing to higher disappearance. As well, increasing prices for competing grains such as pulses and canola have put producers in a better position to sit tight and watch the move, while an overall high-quality prairie crop has tightened feed supplies.
While it may be difficult to see a nearby end to this trend, a supply side surprise in Statistics Canada's final production estimates in early December could be a factor. Both the Saskatchewan and Alberta governments have estimated barley yields higher than the most recent Statistics Canada official estimates.
It is interesting to note that the upper-end of the government's feed wheat price delivered Lethbridge is seen at $275/mt, which compares to pdqinfo.ca's southern Alberta average price for No. 1 CWRS 13.5% protein bid of $248.49/mt.
**
DTN 360 Poll
Given the recent losses experienced in the futures trade of the major grains and oilseeds, do you think we've seen the highs for the crop year? You can weigh in with your thoughts on this poll found on the lower-right side of your DTN Canada Home Page. Thanks for your input.
Cliff Jamieson can be reached at cliff.jamieson@dtn.com
Follow him on Twitter @Cliff Jamieson
(c) Copyright 2020 DTN, LLC. All rights reserved.


Comments
To comment, please Log In or Join our Community .