Canada Markets
Troubling Technical Signs on Palm Oil Chart
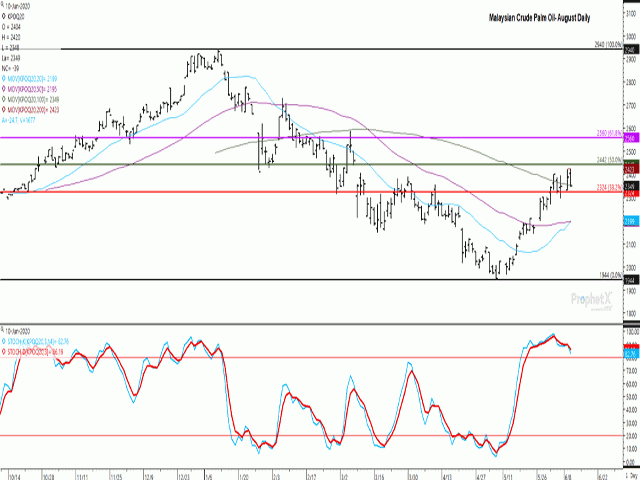
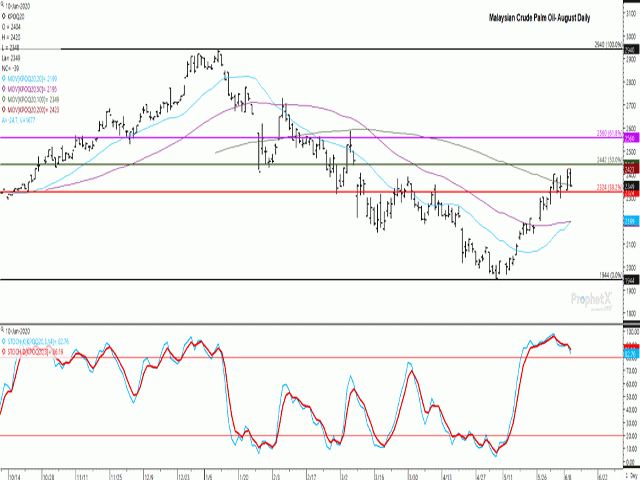
Since reaching a May 6 contract low of 1,944 ringgits, which is the local Malaysian currency, price has breached a number of technical resistance levels to reach a high on June 9 of 2,422 ringgits, its highest trade since the week of March 2 or almost 14 weeks.
This high falls just under the 2,442 level which is the 50% retracement of the move from the January high to May low without testing this resistance. This week's high also comes close to testing the 200-day moving average, calculated at 2,423 on June 10 although barely visible on the chart.
June 10 trade saw prices consolidate within Tuesday's range without testing the high, while ending 1.6% lower for the session. Support lies at 2,349 ringgits, the contract's 100-day moving average and also equal to the June 10 close, while a move below 2,298 or a further 2.2% decline would signal a move to a four-session low and signal a possible move into a downtrend.
P[L1] D[0x0] M[300x250] OOP[F] ADUNIT[] T[]
While this focus is on technical signals, Wednesday's pause in trade came despite favorable fundamental data released. Malaysia's government has recently announced an exemption on export duties of refined and crude palm oil until December, just weeks after India announced it would resume purchasing supplies from Malaysia after a four-month dispute.
Statistics released on June 9 shows that May inventories of all Malaysian palm oil stocks are down 0.5% from the previous month, while crude stocks fell by 4.6% month over month. Malaysia's Palm Oil Board data shows exports increasing by 10.7% in May from the previous month, while a June 10 industry estimate points to a potential 64% increase in the June 1-10 period and another industry estimate points to a potential 60% increase month-over-month.
Dow Jones commentary this week states that all of the bullish news has been priced into the current market, with a further catalyst needed to spark a further move higher. Perhaps it will be supportive soybean data in the June 11 USDA WASDE report.
**
DTN 360 Poll
This week's poll asks which crop you are most comfortable storing and carrying into the next crop year. Feel free to share your thoughts on this week's poll on the DTN Canada site.
Cliff Jamieson can be reached at cliff.jamieson@dtn.com
Follow him on Twitter @Cliff Jamieson
© (c) Copyright 2020 DTN, LLC. All rights reserved.


Comments
To comment, please Log In or Join our Community .