Fundamentally Speaking
Delayed Corn Seedings Impact Final Soybean Area
The March prospective planting figures are just a starting point for corn and soybean seeded area pending how fast spring seedings proceed as can say start of U.S. growing season begins on Saturday.
That will steer trade along with finish of South American growing season, Black Sea strife and impact on macro markets from what looks like more Fed tightening and consequent influence on grain and oilseeds complex.
P[L1] D[0x0] M[300x250] OOP[F] ADUNIT[] T[]
As we have witnessed over the past few seasons, Mother Nature can have a large say in whether farmer intentions turn into reality as have seen big changes in both corn and soybean planted acreage from the March intentions into the June Acreage report and then from there to the final figures given in the annual production report based on the vicissitudes of weather.
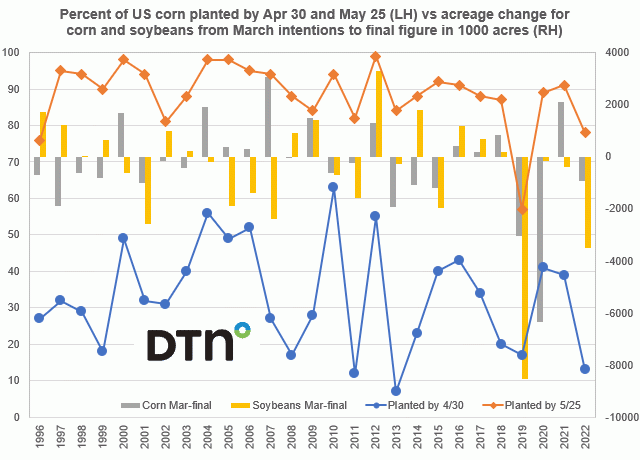
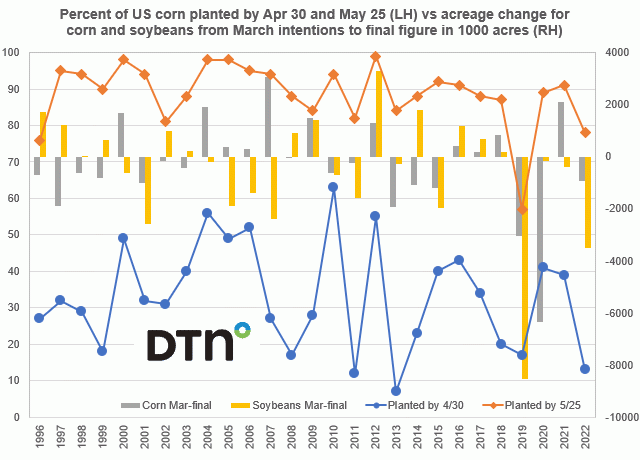
This chart shows the percent of U.S. corn planted by April 30 and May 25 on the lefthand axis while reported on the righthand axis is the acreage change for corn and soybeans from the March intentions to the final figure in 1000 acres.
Last year's corn planting pace was slow throughout the spring based on cold and wet conditions in much of the Upper Midwest with the 13% in the ground as of April 30 the third lowest since 1996 and the 78% seeded by May 25 the second lowest total since 1996.
This did result in corn area falling by 911,000 acres from March to the final production report though the impact on soybeans was even greater for as farmers continued to plant corn even with the lagged pace of seedings, this resulted in soybean area falling over 3.50 million acres from March to the final figure which is the second largest decline since 1996.
Note that the slowest corn planting pace seen since 1996 was in 2019 when only 57% of the crop was in the ground by May 25 and though corn area fell by 1.955 million acres, soybean acreage plunged between the March intentions and final figure to the tune of 8.517 million acres.
A look at the correlations between corn and soybean seedings and the percent of corn planted by April 30 and then May 25 shows the highest percent at 50% between soybean acreage changes in the percent of corn seeded by May 25.
(c) Copyright 2023 DTN, LLC. All rights reserved.


Comments
To comment, please Log In or Join our Community .