

Fundamentally Speaking
Corn Fed Per Grain Consuming Animal Unit Versus Average Farm Price of Corn
USDA will release several reports Jan. 12, 2023, including the first estimate of 2023 U.S. winter wheat seedings, the final 2022 U.S. corn and soybean production figures, the monthly WASDE report and also the quarterly grain stocks on- and off-farm as of Dec. 1, 2022.
The stocks numbers are always of interest, at least in corn, because that is the way the trade gauges feed usage as this number is backed into from total supplies minus export and food, seed, and industrial demand. USDA's 2022/23 corn feed estimate of 5.30 billion bushels (bb) is the lowest since the 2015/16 season linked to historically high corn prices and falling grain consuming animal units (GCAU).
P[L1] D[0x0] M[300x250] OOP[F] ADUNIT[] T[]
Along these lines, seeing that Friday's Cattle on Feed report showed there were 11.673 million head of cattle in large feedlots (1,000-plus head) as of Dec. 1 -- down 312,000 head or 2.6% from year-ago -- while USDA also estimated the Dec. 1 hog herd at 73.119 million head, down 1.327 million head or 1.8% from the year-ago level.
In this month's WASDE report, USDA pegged GCAUs to be 99.22 million units in 2022/23 down from 100.04 in 2021/22 at the lowest level since the 2017/18 season paced by a near 4% decline in beef cattle numbers. Total feed and residual use for feed grains and wheat in the United States for 2022/23 (September through August) is projected to be 141.96 million metric tons (mmt) which is 3.4% lower than the 2021/22 estimate of 147.09 mmt.
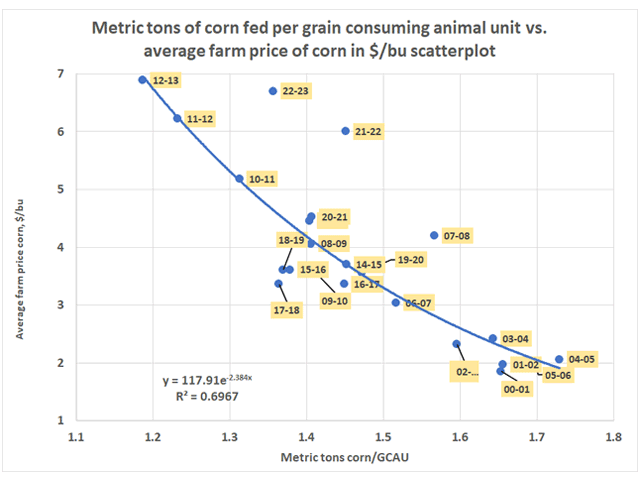
The corn feed figure of 134.63 mmt is down, however, by a steeper 7.3% from the 2021/22 level of 145.21 mmt and results in a corn per GCAU figure of 1.357 metric tons, which would the lowest amount of corn fed per GCAU since the 2012/13 season when the average corn price hit a record $6.89 per bushel in the wake of that season's devastating drought.
This graphic is a scatterplot of the metric tons of corn fed per grain consuming animal unit versus the average farm price of corn and, as expected, it shows an inverse relationship with high prices resulting in lower corn fed per GCAU and vice-versa with the formula explaining about 70% of the variability seen in corn feed use.
Though some feel the USDA may be understating corn feed use in light of high wheat and DDG prices, the graph does show that given the second highest average farm price ever this season at $6.70/bushel, the 1.357 MT/GCAU projection is far higher than the 1.22 that is calculated by the trendline formula.
We should note that over the past five years Sep-Nov corn feed use has averaged 44% of the annual total, implying a corn feed use of 2.332 billion bushels when the Dec. 1 corn stocks number is released.
(c) Copyright 2022 DTN, LLC. All rights reserved.

Comments
To comment, please Log In or Join our Community .