Fundamentally Speaking
End of July Crop Ratings
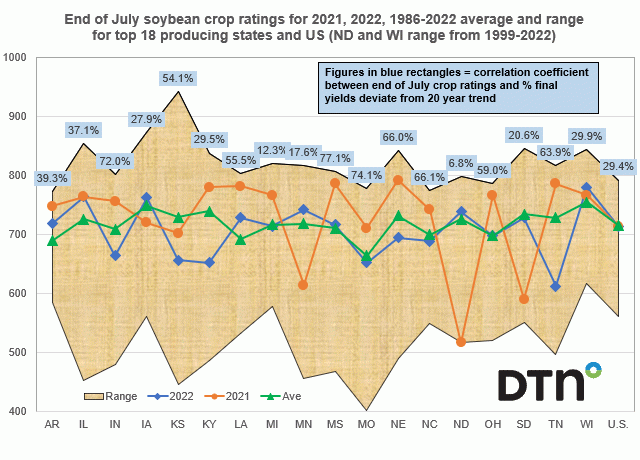
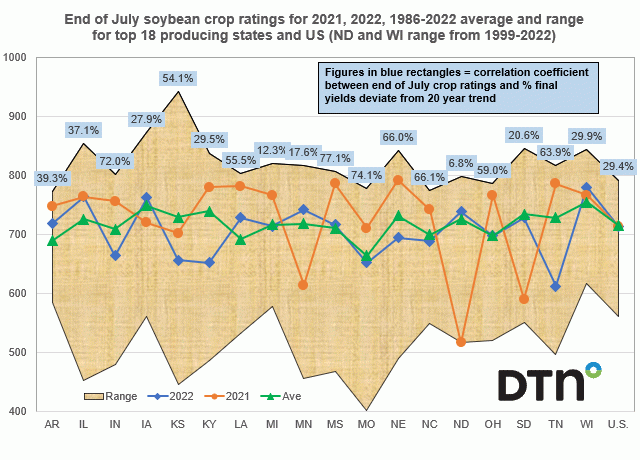
August is key month for soybeans, so similar to what we did for corn in an earlier piece, using our usual ratings system (where we weight the crop based on the percent in each category and assign that category a factor of 2 for very poor, 4 for poor, 6 for fair, 8 for good, and 10 for excellent and then sum the results) we look at the end of July soybean crop ratings for the top 18 producing states and the U.S.
We have data from the start of national ratings back in 1986 to the figures that were furnished this past Monday with the data range for North Dakota and Wisconsin going from 1999 to 2022.
P[L1] D[0x0] M[300x250] OOP[F] ADUNIT[] T[]
The end of July 2022 U.S. soybean rating of 714 is equal to the year ago rating when the final yield came in at 51.5 bpa, which is not only the second highest ever but also what USDA is currently using for this year's yield and this rating is almost equal to 1986-2022 average.
Also 10 of the 18 states have end of July crop ratings above their long-term average as compared to corn where only 6 of the 18 states have 2022 end of July crop ratings above their respective 1986-2022 averages.
States doing quite well include Iowa, ND, SD and MN at levels well above last year, also similar to what was seen in corn.
The point here is that heading into Friday's USDA August crop report, to us it appears there is a greater chance that the USDA will maintain their current soybean yield estimate of 51.5 bpa as bean crop conditions are relatively better than corn.
A lot more acreage seen in the Delta and Ohio Valley states over the past two weeks have seen a nice increase in rainfall with some areas actually seeing too much after being shortchanged earlier in the season.
(c) Copyright 2022 DTN, LLC. All rights reserved.


Comments
To comment, please Log In or Join our Community .