

Fundamentally Speaking
Prices Boost Seedings
USDA will furnish some key reports on Jan. 12, 2022, including the annual Crop Production report and the quarterly On- and Off-farm Grain Stocks as of Dec. 1, 2021. Those reports will be incorporated into that day's release of the January 2022 World Ag Supply-Demand Estimates (WASDE).
Almost lost in the background is that USDA will also issue its first estimate of how much winter wheat U.S. farmers seeded for the 2022 crop.
Based on some of the highest prices in years, producers are expected to have increased their winter wheat seedings above the 2021 level of 33.65 million acres, which was the highest amount of winter wheat planted since 2016.
P[L1] D[0x0] M[300x250] OOP[F] ADUNIT[] T[]
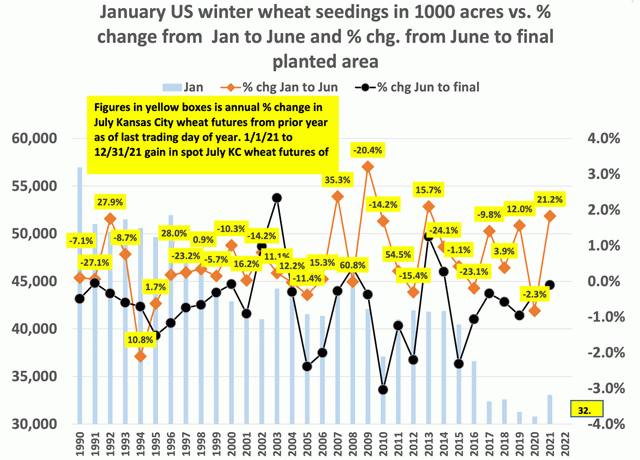
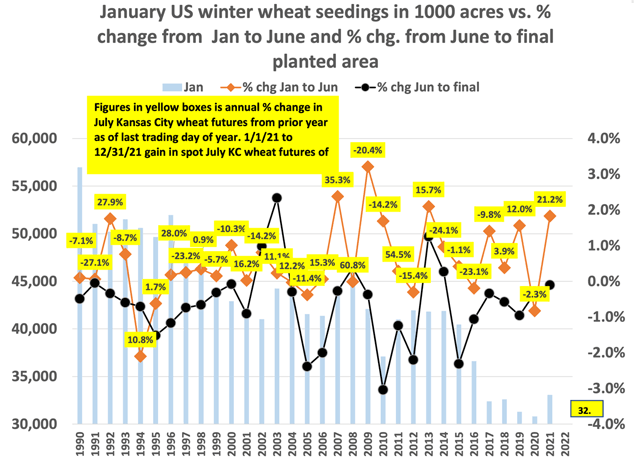
This graph shows USDA's January U.S. winter wheat seedings projections in 1,000 acres on the left-hand axis vs. the percent change from that January figure to what was reported in the June Acreage report and then the percent change from June to the final planted area figure given in the Sept. 30 Small Grains summary report on the right-hand axis. We also report in the yellow boxes the annual percent change in July Kansas City wheat futures from prior year as of last trading day of year.
Some observations include the steady decline in U.S. winter wheat planted over the years from close to 57 million acres back in 1990 to just shy of 31 million last year. This has also been the case with spring and white varieties as wheat yields and returns per acre have not kept up with other crops.
We also note the updated planted area figure in the June acreage report is usually very close to what was indicated in January, averaging a 0.5% increase. In fact, there are only two times when the June planted figure was more than 0.8% below the January seedings figure -- 2020 and 1994 -- which saw the largest decline of 2.1%. More often than not, the June acreage number is higher than the January figure with the largest upward adjustment seen in 2009 of 3.2%. Similarly, usually not much change from the June to the final figure with the 1990-2021 average being a decline of 0.6%.
Finally, the reason for including the annual percent change in continuous July Kansas City wheat futures is to see if a large percent increase in price triggers a jump in acreage from the prior season and perhaps vice-versa. We note that the close of 2020 the July 2021 KC wheat futures was $6.07 vs. the $5.01 close for the July 2020 wheat futures on 12/31/2019, a 21.2% increase and perhaps was the reason why winter wheat acreage for 2021 was the highest since 2017, up more than 3.0 million acres or 10.5% vs the 2020 figure.
This year's July 2022 KC wheat futures finishing out near $8.07 and that is up 32.9% from the year ago figure, suggesting another increase in U.S. winter wheat plantings this coming season. This is the fourth largest annual increase in July KC wheat futures since 1990, exceeded by a 35.3% increase in 2007, when wheat plantings were up 11% from the prior year, a 54.5% price advance in 2011, when wheat acreage also increased 11% from the prior year, and the largest annual price increase of 60.8% in 2008, resulting in a 3.9% increase in wheat seeding vs the prior year.
Keep in mind in November USDA released long-term baseline assumption figures and for 2022 have projected total U.S. wheat plantings at 49 million acres and over the past ten years winter wheat has accounted for about 72% of all wheat seeded, which works out to 35.3 million acres of winter wheat and that would a 4.8% increase over the 33.648 million acres seeded last year.
(c) Copyright 2021 DTN, LLC. All rights reserved.
Comments
To comment, please Log In or Join our Community .