Fundamentally Speaking
Stocks vs. Commodities
On a macro level we have long noted the buoyant action of the stock market reflects optimism about the future, both in increased economic activity and hopes that a vaccine will soon emerge.
Maybe the commodities markets are starting to realize this also helped by a lower trending dollar and the Fed's tacit acceptance of higher inflation levels than they have tolerated in the past.
P[L1] D[0x0] M[300x250] OOP[F] ADUNIT[] T[]
Some such as copper, gold and lumber have soared but by and large, stocks are still very expensive compared to commodities.
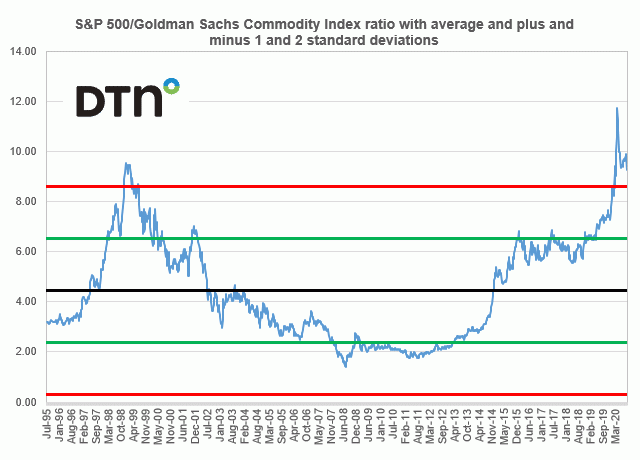
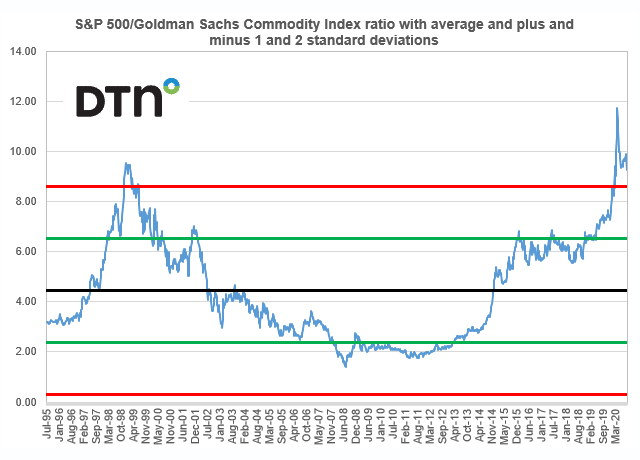
This is reflected on this graphic which shows the S&P 500/Goldman Sachs Commodity Index ratio since mid-1995 with the average (black line) and the plus and minus one (green lines) and two standard deviation lines (red lines).
Today the ratio is 9.305 and though that is down from the end of April high at 11.543, it is more than double the long-term average of around 4.45 and more than two standard deviations above this level which has occurred only 2.5% of the time the last 25 years.
This compares to the low of 1.484 back in June of 2008 in the last recession.
The point here is commodities appear undervalued vs. stocks or vice-versa or some combination and the recent equity market correction appears to be fulfilling one side of that equation.
© (c) Copyright 2020 DTN, LLC. All rights reserved.


Comments
To comment, please Log In or Join our Community .