

Fundamentally Speaking
Stocks-to-Use vs. Average Farm Price

The impact on the corn market from the COIVID-19 situation has been severe.
Ethanol margins have collapsed in tandem with a slide in the crude oil market and may shave at least 500 mln bushels off food-seed-industrial usage.
Notwithstanding the recent USDA decision to up feed/residual usage this year by 150 million bushels (mb) (based on a low March 1 quarterly stocks figure which actually could be more reflective of an overstated 2019 crop), the collapse in feeding margins and slowdown in slaughterhouse and packing plant operations suggests large poultry and livestock liquidation the second half of this marketing year.
That has sent nearby corn futures to their lowest levels since the summer of 2016.
P[L1] D[0x0] M[300x250] OOP[F] ADUNIT[] T[]
Forward values could fall even more should the 3/31 Prospective Plantings report, which indicated U.S farmers intend to seed 97 million acres of corn, three million more than expected is realized.
With higher intended plantings and demand cut sharply due to COVID-19 2020/21, ending U.S. corn stocks could be highest since 1987/88 year at well over 3.3 billion bushels (bb) and stocks-to-use ratio largest since 1992/93 if one were to take the USDA demand figures they gave at their February 2020 Ag Outlook Forum which now seen very high.
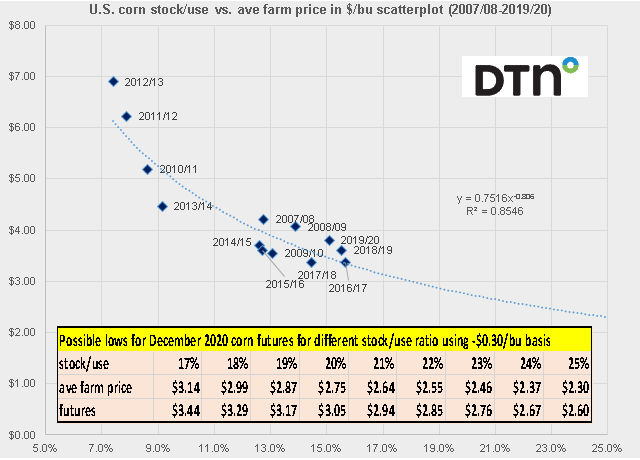
This graphic shows the U.S. corn stocks-to-use ratio vs. the average farm price scatterplot using data from the 2007/08 season to this year and the calculated trend line explains about 85% of the projected farm price using the stock to use ratio.
We assume that the average farm price is $0.30 cents below corn futures so using various stock to use ratio figures some possible average farm price and new crop futures prices can be calculated for the 2020/21 marketing year.
Using the March intentions figure of 97 million acres and the harvested/planted ratio ad 178.5 bpa yield along with the Outlook Forum corn total usage figure of 14.740 bb this results in a 22.4% stock to use ratio which projects to an average farm price of around $2.55 and futures at $2.85.
It may be that due to the recent strength of soybeans vis-a-vis corn that planted area will not come close to 97 million and note the USDA's 178.5 mb projected 2020 corn yield is forecast at record high levels that also may not come to pass.
We will find out next month when the USDA issues its first take on the 2020/21 U.S. corn balance sheet in the May 2020 WASDE just how much demand will be slashed from what their economists projected a mere three months ago.
(KLM)
© Copyright 2020 DTN/The Progressive Farmer. All rights reserved.
Comments
To comment, please Log In or Join our Community .