Fundamentally Speaking
Corn Crop Conditions vs Yield Analysis
USDA releases the next crop production report on October 11, 2018. Pre-report expectations of another increase in the 2018 national corn yield are based on stellar harvest results so far and the historical tendency for upward revisions in the corn yield when the USDA has already boosted its projection from the August to the September report, especially if new record yields have already been established.
Along these lines, the brokerage firm FC Stone has increased their 2018 U.S. corn yield estimate from 177.7 to 182.7 bushels per acre (bpa) vs. 181.2 bpa for USDA and the prior peak set a year ago at 176.6 bpa.
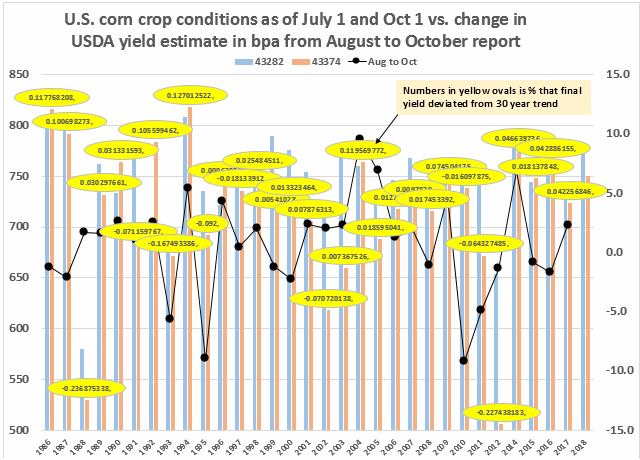
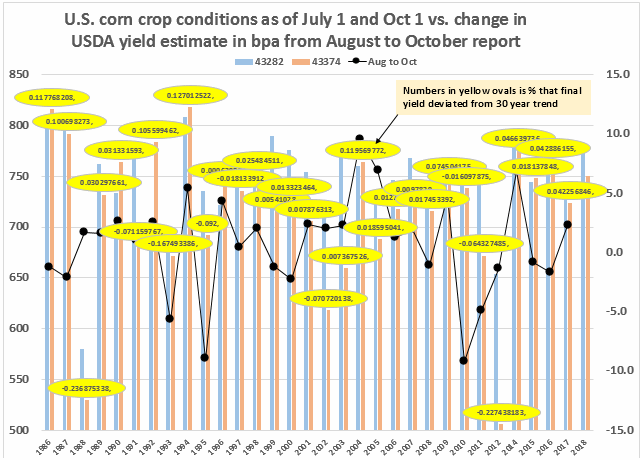
This graphic shows U.S. crop conditions as of July 1 and October 1 using our usual ratings system where we weight the crop based on the percent in each category and assign that category a factor of 2 for very poor, 4 for poor, 6 for fair, 8 for good, and 10 for excellent and then sum the results.
These vertical bars on the left hand axis are plotted against the change in the USDA’s national corn yield estimate from the August to the October report in bushels per acre on the right hand axis. We also post for each year 1986 to 2017 the percent that the final U.S. corn yield deviated from the 30-year trend in the yellow ovals.
P[L1] D[0x0] M[300x250] OOP[F] ADUNIT[] T[]
Final yield
Year rating % above trend
2018 750
2014 766 4.3%
2009 748 7.5%
2004 764 12.0%
Keep in mind, however that the current USDA 2018 yield of 181.2 bpa is already 5.6% above this year’s calculated 30 year trend of 171.5 bpa. On the other hand, we do note the 30-point drop in crop conditions over the past three months from 780 to 750 and we note the three-year period of 2005 to 2007 when the average rating drop from July 1 to October 1 was 35 points, which corresponded to an average yield 1.4% above trend.
As a final note, a regression using the October 1 crop rating, the change in the crop rating from July 1 to October 1 and the change in the USDA corn yield estimate from the August to the October report explained 89% of the variability in predicting the percent that final corn yields deviate from the 30-year trend.
(KLM)
© Copyright 2018 DTN/The Progressive Farmer. All rights reserved.


Comments
To comment, please Log In or Join our Community .