

Fundamentally Speaking
Corn Development vs. Yield

As we head into the USDA's first field-based crop production report, there continues to be a lot of talk about the advanced state of the U.S. corn crop linked to relatively high temperatures this summer and whether this fast pace of development has come at the expense of yield.
Recall last year, despite crop ratings far below those that are prevailing this season, below average temperatures especially in August resulted in a record national corn yield.
This is thought to have aided kernel fill as the extended period towards maturity was seen enhancing dry matter accumulation.
This year some fear the opposite is true.
P[L1] D[0x0] M[300x250] OOP[F] ADUNIT[] T[]
Sort of tough to determine exactly what final yields will be as the USDA usually does not have a good handle on that until the October crop production report.
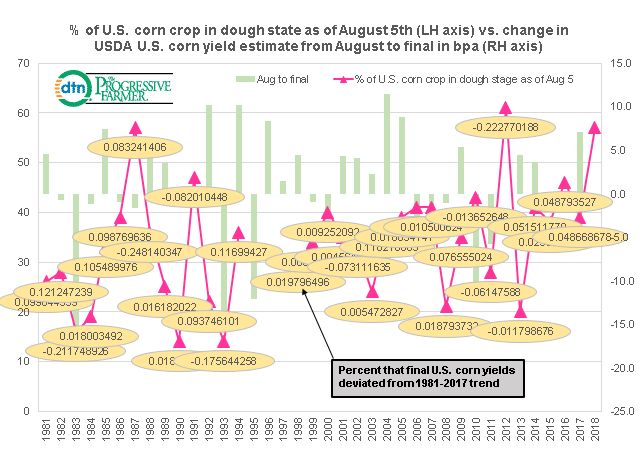
Nonetheless, this graphic shows the percent of the U.S. corn crop in the dough state as of August 5th on the left hand axis vs. the change in the USDA's national corn yield from the August to the final crop production report released the following January in bushels per acre (bpa) on the right hand axis.
We also show the percent that the final corn yield deviated from the 1981-2017 trend in the yellow ovals.
The period examined is 1981 to 2018, though we have no data for the percent that the U.S. corn was in the dough stage from 1995 to 1997 as the crop was apparently not advanced enough those years to have any data for early August.
This year's crop is quite advanced with 57% in the dough state as of August 5th.
The only other years that were that fast was the drought year of 2012 when 61% of the crop was in the dough stage with final yields that season 22.3% below the 1981-2017 trend with the yield unchanged from the August to final report, and in 1987 when 57% was also in the dough state as of 8/5 though final yields that season were 8.3% above trend though the yield did fall from the August to the final report by 1.6 bpa.
Since 1981 the average percent of the U.S. corn crop in the dough stage as of August 5th is 37%, so other accelerated years include 1991's 47% with final yields off 8.2% from trend with August to final yield gains of 0.8 bpa, 2016 when 46% of the crop was in the dough state with final yields 4.9% above trend with the final yield 0.5 bpa below the August estimate, and 2010 when 43% of the crop was in the dough stage with final yields that season 1.4% below trend and yields falling by 12.2 bpa from the August to final crop production report.
The correlations between the percent in the dough stage and the percent deviation from final yields is very low, and while the correlation between the percent in the dough stage as of August 5 and the change in yields from the August to final report is slightly higher it is also very low, though it does appear that an accelerated pace of the crop in the dough state does not lend itself to large August to final crop report yield gains.
(KA)
© Copyright 2018 DTN/The Progressive Farmer. All rights reserved.
Comments
To comment, please Log In or Join our Community .