

Fundamentally Speaking
World Stocks-to-Use Ratios
Grain and oilseed futures may have jumped in the wake of the last USDA crop production and WASDE reports issued October 12 but price gains scored in the immediate aftermath of those figures have faded.
Increased farmer sales, the realization that the numbers themselves were not all that bullish and a generally negative fundamental outlook for all of these markets have weighed on values since then.
P[L1] D[0x0] M[300x250] OOP[F] ADUNIT[] T[]
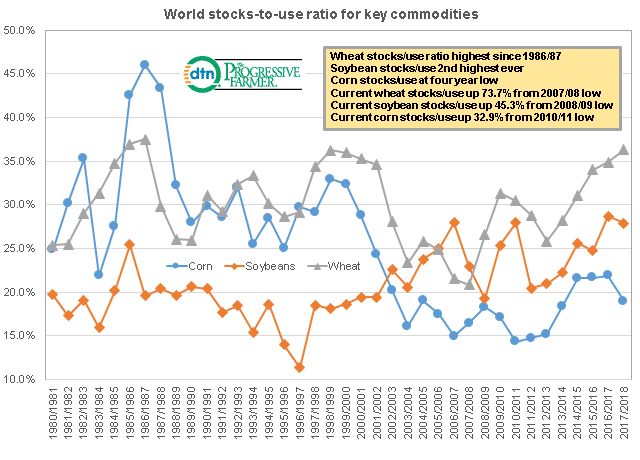
With regard to the latter point, the new global figures have allowed us to update the world stock to use ratios for corn, soybeans and wheat going back to the 1980/81 season and they do not present a pretty picture.
Corn may have the least burdensome situation with the current 19.0% stock to use ratio the lowest in four years and 4.0% higher than the 10-year average though down 6.6% from the 20-year average.
The current corn stock to use ratio is also 32.9% higher than the recent low going back to the 2010/11 season.
The current soybean stock to use ratio of 27.9% appears to be the second highest ever next to the year ago 28.7% ratio and is 14.6% ahead of the 10 year average and 22.1% higher than the 20 year average with the 2017/18 ratio up 45.3% from the recent low seen in the 2008/09 season.
Finally, the global wheat stock to use ratio also appears to be the second highest ever at 36.3%, barely edging out the old high of 37.5% seen back in the 1986/87 season.
This is 18.1% above the 10-year average, 23.6% ahead of the 20-year average and a whopping 73.7% higher than the ratio back in 2007/08, a time when high wheat prices fueled bread riots across the planet.
(KA)

Comments
To comment, please Log In or Join our Community .