

Canada Markets
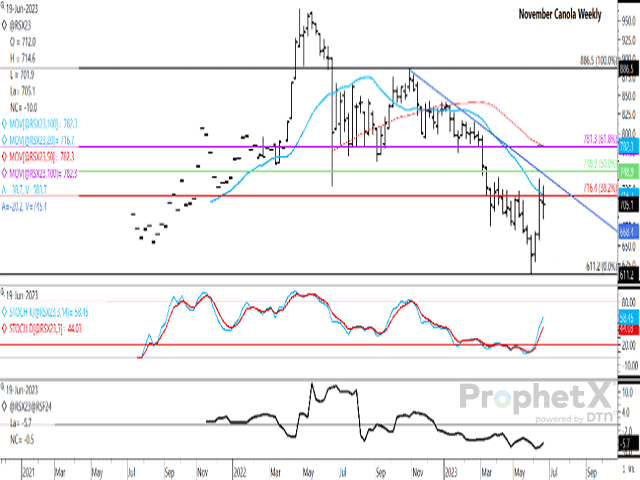
November Canola Shows Resilience
New-crop canola trade remains caught between concerns of dry conditions on the prairies and this week's disappointing data release from the United States Environmental Protection Agency which stated the 2024 and 2025 biofuel blending mandates that were below volumes hoped for.
The November contract lost $10/mt on Friday to close at $705.10/mt, consolidating within Thursday's trading range in a sideways move. The daily chart (not shown) show the November contract failing at the contract's 100-day moving average on June 16 and June 20, while has struggled with this resistance since. It is interesting to note that this week's lows on the daily chart (not shown) shows support above $700/mt, after bouncing from this level in three of this week's sessions.
One point worth mentioning is that the daily close over six sessions has held within a $15.50/mt range, from $720.60/mt on June 21 to $705.10/mt today. The trading range over this period was much greater at $52.30/mt.
P[L1] D[0x0] M[300x250] OOP[F] ADUNIT[] T[]
A second point to consider is that the November contract's failure at the 100-day moving average led to sideways trade overall below this resistance, which compares to the move in rapeseed that closed above its 100-day moving average on June 15 only to close EUR 42.50/mt lower over the next five sessions, with weekly momentum indicators rolling over near the mid-point of the neutral zone on the chart.
The first study on the attached chart shows momentum indicators on the weekly chart still trending higher, while both November soybeans and October soybean oil futures show early signs of stalling.
The Nov23/Jan24 spread on the lower study has strengthened for a second week to minus $5.70/mt. This is the second-lowest carry or spread seen for this date over the past five years, next to the minus $1.70/mt shown for June 23, 2021, while is narrower than shown on this date in four years of the past five years.
While not shown, weekly CFTC data shows noncommercial traders paring their bearish net-short position in canola futures for the first time in five weeks, while to the smallest bearish position held in almost four months.
Cliff Jamieson can be reached at cliff.jamieson@dtn.com
Follow him on Twitter @Cliff Jamieson
(c) Copyright 2023 DTN, LLC. All rights reserved.

Comments
To comment, please Log In or Join our Community .